Updated February 17, 2023
Definition of Jira Burndown Chart
There are multiple tools available in the market to track the project; Jira provides different features to the user, with the burndown chart being one of the features that Jira provides. A burndown chart shows the total amount of work completed in a specific sprint or epic and how much work is remaining. In other words, we can say that a burndown chart is used to show the timeline of work within a specific team which means how much is required to complete their work. Typically Jira burndown chart depends on the agile methodology.
What is the Jira burndown chart?
Jira is an issue following apparatus by Atlassian, Inc. Project Management programming highlights coordinated effort offices. Unexpectedly, Jira is a Bug Tracking and Project Management program that helps groups work together and communicate. This strong multifunctional programming is necessary for Agile, Project Management, Software Development, and Task Management groups.
Jira programming is viable with a ton of instruments. You can incorporate it with other helpful programming projects to finish your work. Luckily, most of these instruments are not challenging to set up and cost nothing. Jira has a broad scope of capacities, yet the focal point of this point is how to assemble Burndown Charts with the product.
Thus, here we will acquaint you with the Jira Burndown graph inside agile systems, and you will figure out how to fabricate a Jira Burndown outline. Likewise, you will know the highlights and advantages of utilizing the Jira Burndown Chart.
Burndown outlines previously started in the Scrum technique. The thought behind building a Jira Burndown Chart is to fix all issues concerning assessing projects. As a result, Jira Burndown Chart shows a descending pattern of work remaining (frequently known as work underway) over the long run. It additionally fills in as an early advance notice framework for projects in peril while permitting groups to make fundamental moves before it’s past the point of no return.
Also, Jira Burndown Chart offers a down-to-earth and viable approach to overseeing projects. They show the situation with every one of your assignments in one straightforward organization, assisting you with following your group’s advancement and recognizing essential regions that could require more consideration.
How to Create a Jira burndown chart?
Now let’s see how we can create the burndown chart in Jira.
For creating a burndown chart, we need to consider some elements.
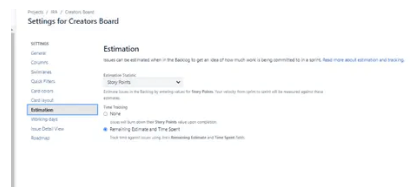
- First, we need to set the estimation statistic: At this point, we need to determine how much work is completed. Estimation statistic is nothing but the measurement unit that can be used to estimate the work in terms of a story point, hours or stories, etc., and the measurement unit depends on the team. The assessment measurement assists with working out the group speed for each run, which is the amount of the assessment measurement for finished stories. Speed proves to be helpful during run arranging.
- Now we need to click on the estimation
- Here we need to set the team estimate statistics.
The following screenshot shows some basic settings of the chart as follows.
- In the second step, we need to enter the estimate: Assessing stories help conclude how long would be expected to get done with specific jobs in the run. Before the beginning of the run, you want to enter the gauge. This could be in the story focuses or another gauge you have picked. For entering estimates, we need to follow the following steps as follows.
- First, go to the backlog of our respective projects.
- In the second step, we need to select the issue; after selecting the issue, we can see the details on the right side.
- So here, we can enter the estimate as per our requirement, as shown in the following screenshot.
Jira burndown chart Report
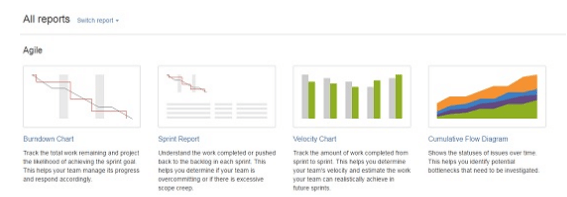
Now let’s see how we can generate the burndown report as follows.
1. First, we need to select the project inside the project and click on a report from the left-side menu. Here we can see Agile and click on the burndown. This is the first step, as shown in the following screenshot.
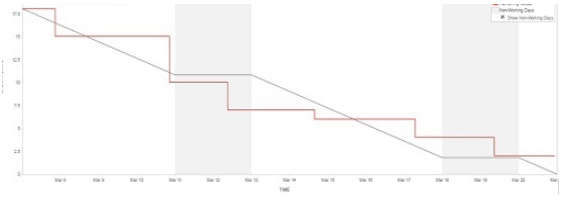
2. Now, we can see the burndown chart of the Sprint, where the red line is used to display how much work is pending, and the gray line is used to display the committed tasks. The group can see where they stand as far as the advancement of the run when contrasted with the responsibility at the beginning of that run. The client can change the Sprint and Y-hub by determination from a dropdown, as shown in the following screenshot.
The second piece of the report shows information like the run start date, all issues that were added, step by step the number of issues settled, what story points of the issues are, and step by step the number of the remaining story focuses.
Jira burndown chart Types
Now let’s see different types of burndown charts as follows.
- Sprint Burndown chart: A Sprint Burndown Chart is utilized to follow the definitive work in a Sprint Project. It likewise gauges the probability of accomplishing a characterized task objective. It shows the finished work each day against the extended pace of fruition for each run. Following this data through a given run, groups can deal with their advancement more realistically.
- Epic Burndown Charts: An Epic Burndown Chart empowers Scrum Teams to show their advancement during the Sprint. This diagram shows you how the group is doing on an Epic. In addition, groups can perceive the amount of an Epic has left and the effect of changes during a Sprint.
Conclusion
With the help of the above article, we try to learn about the JIRA burndown chart. From this article, we learn basic things about the JIRA burndown chart, and we also see the integration of the JIRA automation and how we use it in the JIRA burndown chart.
Recommended Articles
This is a guide to Jira Burndown Chart. Here we discuss the Definition, What is the Jira burndown chart, How to Create a Jira burndown chart, and examples with code implementation. You may also have a look at the following articles to learn more –


