Updated July 3, 2023

Introduction to JMeter Performance Testing
JMeter is an open-source, free performance and load testing tool on static and dynamic web-based applications. In static, we can consider JavaScript and HTML; conversely, we have JSP, AAX, and Servlets for dynamic. JMeter gives us a graphical representation of performance testing, such as a tree, table, report, and graph. JMeter is free as well as user-friendly, and it mainly allows us to automate our work as per user requirements.
Overview of JMeter Performance Testing
Confirming whether the item meets the expected or required execution is vital. Tragically, we sort out this trap post conveyance of the item. In any case, execution has become an unavoidable variable, particularly for web and versatile applications, as the client’s strength is immense for every application. Execution Testing is characterized as programming testing to guarantee that product applications will perform well under their normal responsibility.
It centers on specific elements of a Software Program, for example:
- Speed: It checks whether the reaction of the application is quick.
- Adaptability: It decides the most extreme client load.
- Solidness: It checks to assume the application is steady under shifting burdens.
- Load testing: It is nothing but how many users access it simultaneously.
- Stress testing: In stress testing, we need to check the limit of the application, which means how many users can handle the application.
How to Use JMeter Performance Testing?
Let’s see how to conduct performance testing JMeter as follows. Before conducting performance testing, we need to determine some points as follows:
- Normal load of application: At this point, we need to consider the number of users visiting the website.
- Heavy load of application: Here, we need to define the maximum number of users visiting the website.
Now we need to follow different steps to conduct performance testing as follows:
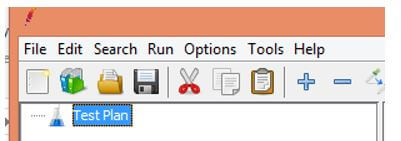
First, we need to start the JMeter and select the test plan, as shown in the below screenshot.
In the second step, we need to add the Thread Group inside the test plan, which means writing, clicking on Test Plan, selecting Add, moving the mouse on Thread, and clicking on Thread Group, as shown in the below screenshot.
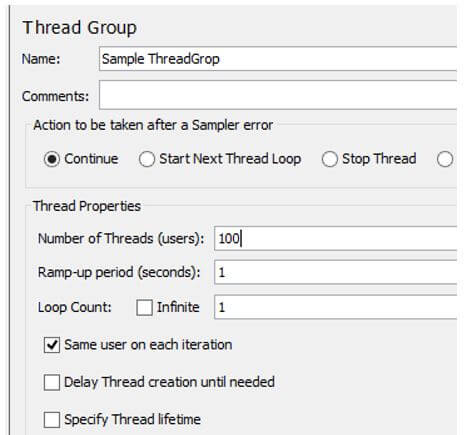
After clicking on Thread Group, we get a new screen where we can put the details, such as the thread’s name, the number of users and loop count, and other functions, as shown in the screenshot below.
Here the number thread means how many users can access the specified website, and the loop count means how many times we need to execute the testing. Ramp-up time is nothing but a time difference between two users.
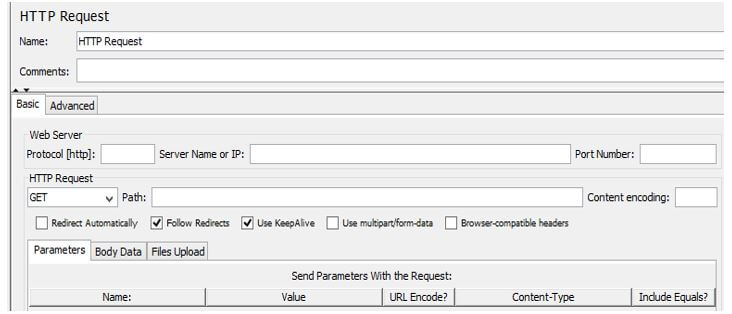
Next, we need to add the JMeter element as per our requirement; here, we added HTTP requests as shown below screenshot.
Here we need to specify the URL we want, so here, we use Google URL as well for the trial purpose. We can also specify the name of the HTTP request, as shown below screenshot.
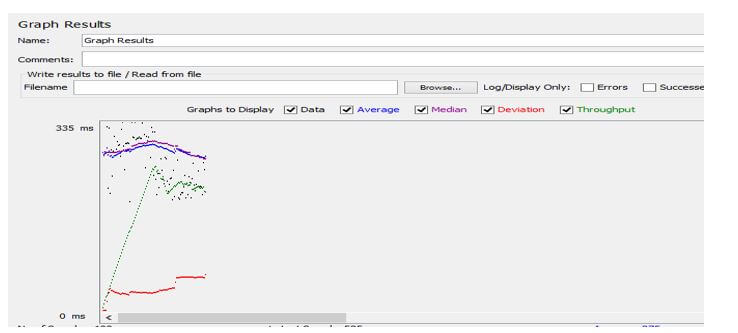
Now we need to add the Listener to see the result, so we need to right-click on our Test Plan, select Add inside the Add, and select the Listener that we want; here, we select Graph as shown below screenshot.
In the next step, we must execute the test plan and see the result in the listener below.
In the above graph, we can see lines with different colors.
- Black: It is used to show the total number of samples sent.
- Blue: It is used to specify the average of current average samples.
- Red: It specifies the standard deviation of samples.
- Green: It shows the throughput rate of requests per minute.
The throughput is the main boundary. It addresses the capacity of the server to deal with a weighty burden. The higher the throughput is, the better the server execution.
The deviation is displayed in red, demonstrating the deviation from the normal.
Create JMeter Performance Testing and Roadmap
1. First, we need to understand performance and loading testing.
2. we can define the Load and Stress testing under the performance testing.
3. Before creating a test plan, we must consider a normal and heavy load of applications.
4. The road map of performance is very simple as follows:
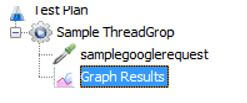
- First, we need to add the thread group inside the Test Plan.
- After that, add a sample to send the request.
- Add Listener to see the result.
- Finally, run the test plan and see the result.
The graphical representation of the roadmap is shown in the below screenshot.
JMeter Performance Testing Tools
Let’s see what the different types of testing tools are as follows:
- LoadNinja: This is one of the tools we can use for performance testing, and it is scriptless load testing.
- Apache JMeter: This very famous tool is used for performance testing.
- WebLOAD: It provides the load generation console for performance testing.
- LoadUI Pro allows us to create scriptless, simple load tests easily.
As well there are many tools available to conduct performance testing.
JMeter Performance Testing FAQs
Given below are the JMeter Testing FAQ:
Q1. How to use JMeter for performance testing?
Answer:
Yes, we can efficiently conduct performance testing with the help of JMeter. In JMeter, we need to follow several steps such as Add Thread, add sampler, and for the result, we need to Listener.
Q2. What type of performance testing do we conduct in JMeter?
Answer:
We can perform performance testing on static and dynamic websites.
Q3. What is throughput in performance testing?
Answer:
Throughout is nothing but the number of units handled per unit of time.
Conclusion
In this article, we saw the different types of JMeter performance testing and the uses and features of these JMeter performance testing. Another point from the article is how we can perform and set up the performance testing in JMeter.
Recommended Articles
We hope that this EDUCBA information on “JMeter Performance Testing” was beneficial to you. You can view EDUCBA’s recommended articles for more information.
