Updated February 21, 2023
Introduction to JMeter Report
JMeter is used to perform the load and performance testing on the application. In JMeter, we need to add the different test cases as per our requirement, but after the execution of the test, we need to see the test case result. So JMeter provides the report generation functionality to the user here; we can generate reports per our requirement. In other words, we can say that the JMeter report provides a summary of the execution in terms of response time and interval time. The main advantage of the JMeter report is that we can generate the HTML files from the CSV files as per our requirements.
JMeter report Overview
JMeter is an open-source execution testing device, yet it is contending to pay for authorized devices with its superior elements in this day and age. One of the fundamental disadvantages of the old JMeter rendition was detailing an experimental outcome examination. Not many audience members were accessible, which required some investment to complete an appropriate examination after finishing the investigation; the execution analyzer needed to make a manual test report, a tedious assignment.
JMeter 3.0 onwards, you can observe another revealing element in JMeter called Dashboard Report. This HTML report has an outline dashboard, including all essential charts. JMeter Dashboard Report takes care of the revealing issue in JMeter.
JMeter report Configuring
Now let’s see how we can configure JMeter configuration as follows.
First, we must ensure that installation is part of JMeter, prerequisites, etc.
When we try to make the Test Plan for a test in JMeter, it is best to maintain the group of samplers as per our requirement, and inside the group of samplers, we have a transaction controller. In JMeter, we have, by default, name policies related to the transaction controller, and we can apply names per our requirement for each transaction controller. The name policy is very important in JMeter because without a name policy; we will face challenges in understanding the HTML report and dashboard.
We also need to consider the following points for configuration as follows.
- It is compulsory, just as prescribed, to uncheck the underneath choices of the multitude of Transaction Controllers.
- Produce parent sampler
- Remember the term of the clock and pre-post processors for created test
- As a matter of course, they are unchecked.
- It is obligatory, just as prescribed, to perform the “Apply Naming Policy” activity for each gathering of samplers inside the individual Transaction Controllers. This should be possible by “right-clicking” on every Transaction Controller.
- Continuously, make sure to restart JMeter on altering any of the .properties, .bat, or .lib documents or adding another module in the JMeter envelope.
- Cripple the undesirable content components like the investigate sampler, audience members, and so on before running a test in GUI or Non-GUI mode.
- Use “Oblique punctuation line” (for example, “/”) while giving File way or Directory way. Then, JMeter perceives the forward slice (for example, ” \ “) as Escape Character.
How to use the JMeter report?
Now let’s see how we can use the JMeter report as follows.
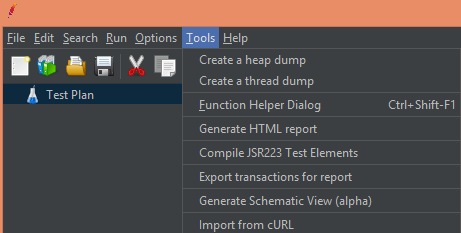
- First, we need to go into the Tool menu; inside the tool menu, we have generated an HTML Report option, as shown in the following screenshot.
- Next, we need to provide the resulting and output paths and click the generate report button.
- Now successful creation of an HTML report dashboard will be appearing.
Example of JMeter Report
Now let’s see the example for better understanding as follows.
First, we need to create the Test Plan; inside the test plan, add the Thread Group. After that, we need to add the sampler and listener to view the result, as shown in the following screenshot.
Now we need to create the CSV by using the following command as follows.
JMeter -n -t “D:\Software\apache-JMeter-5.4.1\apache-JMeter-5.4.1\b
in\View Results TreeNew.jmx” -l “D:\ouput\result.csv” -e -o “D:\ouput\reports”
Explanation
In the above command, we use different parameters such as the path of the JMX file, CSV file name with location, and destination location, as shown in the above screenshot. After executing the above command, a reports folder will be created, and inside that folder, we have an HTML report with the index.html name, as shown in the following screenshot.
Open the “index.html” record inside the output folder utilizing Google Chrome (as Google Chrome upholds the best) and explore through various diagrams on the left half of the Report. Finally, you will get all the test details and diagrams in the right arrangement, as shown in the following screenshot.
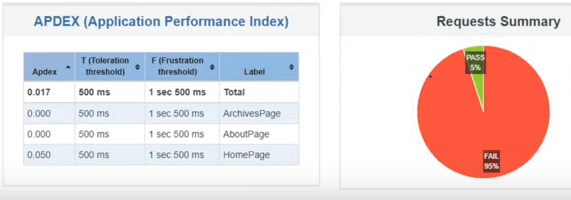
Here, we can also have a dashboard, as shown in the following screenshot.
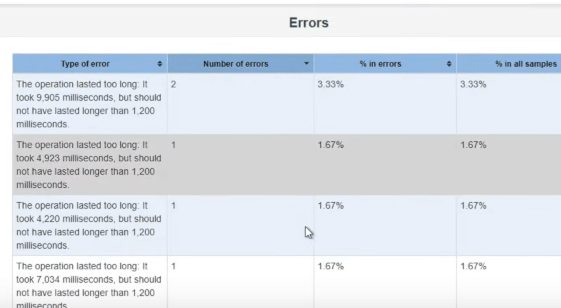
We can also see the errors in the test plan, as shown in the following screenshot.
JMeter report Graph configuration
Now let’s see how we can configure the Graph in JMeter.
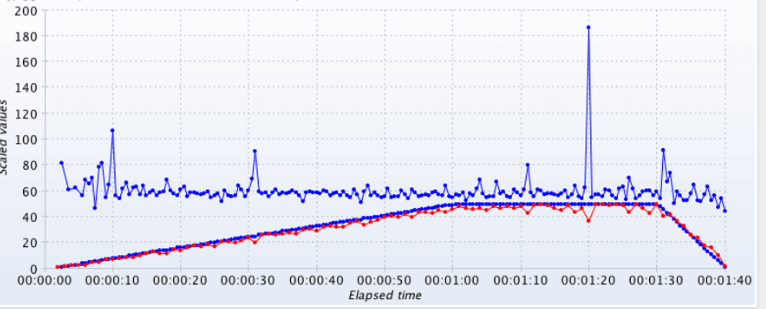
It is a composite graph plug-in that is used to expand the functionality of the listener as per our requirements. Therefore, we can view the result in a single graph. Normally Graph listener contains three different tabs such as Chart, Graphs, and Settings, as shown in the following screenshot.
The Graphs tab contains three areas. First, the present resources show all the rows that can be added to the graph. The composed Graph shows the already selected rows. Finally, the arrow buttons are used for selecting and deselecting rows. Here we can add the different Thread Group and Test Plan as per our requirements, as well as we are also providing the thread and assertion as per requirements.
Conclusion
We hope from this article you learn more about the JMeter report. From the above article, we have taken in the essential idea of the JMeter report and see the representation and example of the JMeter report. In addition, we learned how and when to use the JMeter report from this article.
Recommended Articles
This is a guide to JMeter Report. Here we discuss the essential idea of the JMeter report, and we also see the representation and example of the JMeter report. You may also look at the following articles to learn more –
