Updated March 30, 2023

Definition of JMeter summary report
JMeter is an open-source tool used to perform load and performance testing on applications. JMeter inbuilt has the functionality to generate different kinds of reports such as HTML report as well as JMeter also provides the summary report of Test Plan. The summary report consists of the different rows for each and every Test Plan like an aggregate report. We know that in JMeter we have different listeners to view the result of Test Case execution in different forms such as a table, tree, graph, and log file. Here as per our requirement, we can select any listener. The Summary Report is the primary dashboard perspective on your test while the test is pursued and it has wrapped up. The Summary Report will show up when your test begins to gather information.
Overview of JMeter summary report
A JMeter Test Plan should have an audience grandstand the aftereffect of execution test execution. Audience members catch the reaction returning from Server while JMeter runs and feature as – tree, tables, diagrams, and log documents. It additionally permits you to save the outcome in a record for future reference. There are many sorts of audience members JMeter gives. Some of them are: Summary Report, Aggregate Report, Aggregate Graph, View Results Tree, View Results in Table, and so on
The rundown Report Listener contains a table where a line is made for each solicitation from your test. Total Report fills a similar need however the advantage of Summary report is that it consumes less memory.
JMeter takes into account the absolute time over which the solicitations have been produced. Assuming different samplers and clocks are in a similar string; these will build the absolute time, and thus decrease the throughput esteem. So two indistinguishable samplers with various names will have a large portion of the throughput of two samplers with a similar name. It is vital to pick the sampler marks accurately to get the best outcomes from the Report.
How to Add JMeter summary report?
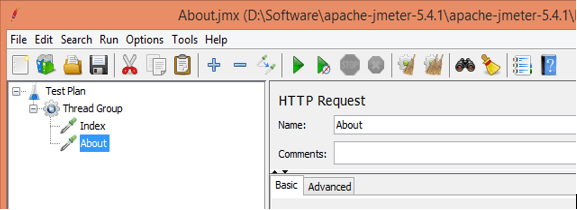
Now let’s see how we can add a summary report in JMeter as follows. First, we need to create a Test Plan as shown in the following screenshot as follows.
Now we need to add the Thread Group into the Test Case as shown in the following screenshot as follows.
After that we added the sampler into Thread Group, here we added HTTP request sampler as shown in the following screenshot as follows.
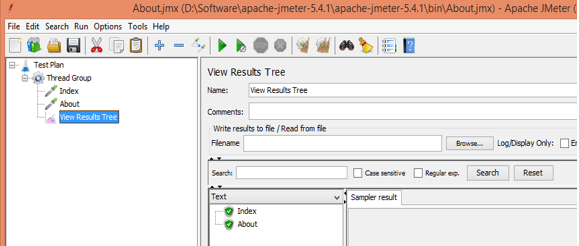
Now add the listener into Thread Group to view the result of the Test Case as shown in the following screenshot as follows.
Our Test Plan is executed successfully, now we need to add the summary report as follows.
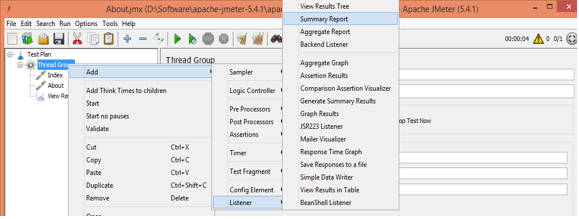
First right click on Thread Group, over the mouse in Listener, and click on the Summary Report option as shown in the following screenshot as follows.
Below screenshot shows the actual content of the summary report as follows.
Now let’s try to understand the different components of the summary report as follows.
- Peruse result from the document: If you as of now have the execution report traded from your past Test runs, you can peruse the record, and Summary Report will stack bring about the table.
- Log/Display as it were: Before beginning the execution you can stamp this choice as “Mistakes” or “Triumphs” or none. The Synopsis Report will show the outcome as needed in the table.
- Save Table Data: This document is shown at the lower part of the Summary Report screen. You can send out the execution result from the table into a CSV record and it gives you the choice to incorporate/overlook “Gathering name in the table” and “Table Header”.
Now run the Test Plan and see the summary as shown in the following screenshot as follows.
JMeter summary report Analyze
Now let’s try to analyze the summary report of the Test plan as follows.
- Label: It is the name/URL for the particular HTTP(s) Request. Here we need to select it as an appropriate name to the label and choose the Thread Group name; it is a prefix of each and every name.
- #Samples: This demonstrates the number of virtual clients per demand.
- Average: It is the normal time taken by every one of the examples to execute an explicit mark. For our situation, the normal time for Label 1 is 0.16 milliseconds and the all-out normal time is 0.16 milliseconds.
- Min: The most limited time taken by an example for the explicit name. On the off chance that we see Min as an incentive for Label 1, out of 02 examples, the briefest reaction time one of the examples had was 0.16 milliseconds.
- Max: The most significant length of time taken by an example for the explicit mark. In the event that we see Max as an incentive for Label 1, out of the 02 examples, the longest reaction time one of the examples had was 0.64milliseconds.
- StdDev.: This shows the arrangement of excellent cases which were going astray from the normal worth of test reaction time. The lesser this esteem, the more steady the information. Standard deviation ought to be not exactly or equivalent to half of the normal time for a name.
- Error%: It is used to show the failed request for each and every label.
- Throughput: Throughput is the number of solicitations that are handled per time unit (seconds, minutes, hours) by the server. This time is determined from the beginning of the first example to the furthest limit of the last example. Bigger throughput is better.
Response Time: It is used to show how much is required to show the result. - KB/Sec: This shows how much information was downloaded from the server during the presentation test execution. So, it is the Throughput estimated in Kilobytes each second.
All these parameters can be seen in the above screenshot.
Conclusion
We hope from this article you learn more about the JMeter summary report. From the above article, we have taken in the essential idea of the JMeter summary report and we also see the representation and example of the JMeter summary report. From this article, we learned how and when we use the JMeter summary report.
Recommended Articles
This is a guide to JMeter Summary Report. Here we discuss the definition, overviews, How to Add JMeter summary report?, Examples with code implementation. You may also have a look at the following articles to learn more –


