Updated March 30, 2023

Definition of JMeter testing
JMeter is a fundamental tool to carry out ramp-up and load testing. It can be used to test in uncomplicated scenarios also. It is launched by Apache and used to compute the performance of software products, services, and applications. It is compiled in Java which is used to test FTP and web applications and the system should be running on Java virtual machine. JMeter is also used in functional and performance testing with minimum complexity and simulates the maximum load on the server by executing different virtual servers on the web. In this article, the setup and performance of JMeter testing are discussed in brief.
What is JMeter testing?
JMeter is used to perform performance, load, functional, and ramp-up testing on software, products, and applications.
The testing in JMeter is followed by a few steps below,
JMeter creates a request and then send it to the server
Then it collects the response from the server and visualizes them in a graph or chart
Then it works on the responses from the server
After processing, it generates the output in various formats like JSON, XML, and text according to the easy analysis of the user.
How to use JMeter testing?
The performance test plan in JMeter can be done under two conditions. One is under normal load where the average number of users visit the website. Other is Heavy load where the maximum traffic hits the website.
A test plan can be executed in a container to run the test. A complete test plan is comprised of one or multiple elements like logic controllers, thread groups, sample generators, timers, assertions, configuration elements, and listeners.
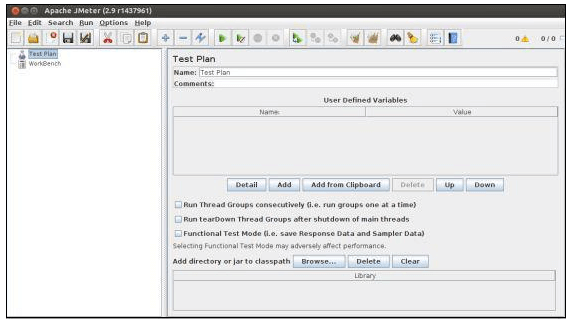
Initiate a JMeter window. There are a test plan node and a workbench node. In the test plan node, the actual plan is saved and in the workbench node, it offers a place to temporarily save the test elements which is not in use.
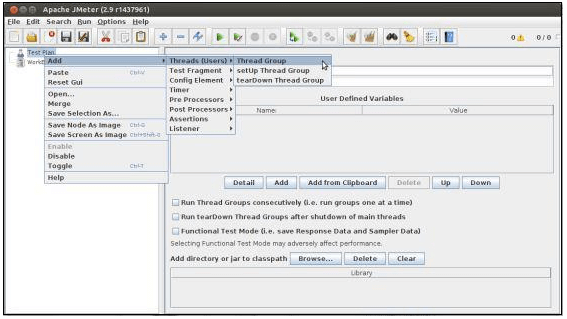
Addition or removal of elements can be done by right-clicking on the add list.
Loading of elements and saving those can be done by right-clicking on the recently added element. If required, JMeter will merge the components into the tree. It is mandatory to save the element as it doesn’t have a default save option.
Configuration of tree elements can be made by using the controls in the JMeter right pane which enables the user to configure the working of the concerned test element. For example, the thread group can be set by the number of users, the number of responses, and ramp-up periods.
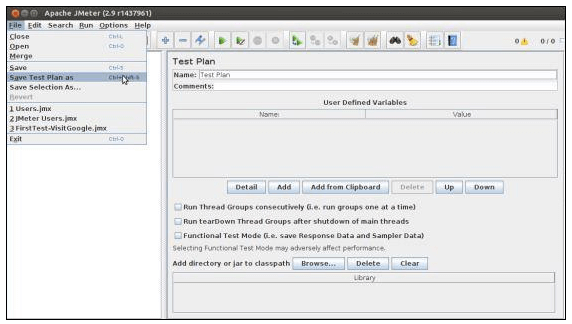
Save the test plan from the file menu to run the entire test on the application.
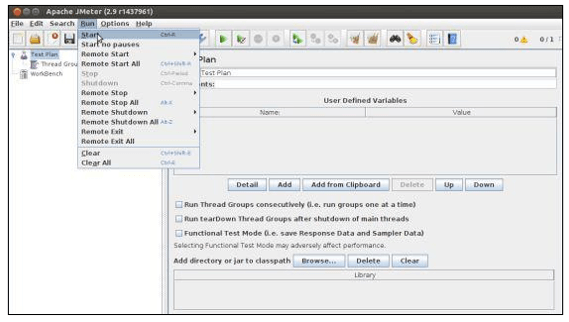
Execute the test plan by choosing start from the Run option. When the JMeter is executed, it displays a green box at the right end pane under the menu bar. The number in the left pane shows an active number of threads. It is applied in the local run test. It doesn’t show any thread which started in remote systems which are under client-server mode.
Shutdown or stopping of test plan can be done by giving Control + ‘.’. stop option is used to stop the thread immediately and shutdown is done at the finishing of any current task.
Create JMeter testing
The JMeter testing is followed in two unique steps, one is to build the test and execute the test.
Build Test:
When the JMeter is initiated the GUI is displayed with an empty test plan. Then choose the load test by using different components and see how it gets stimulated.
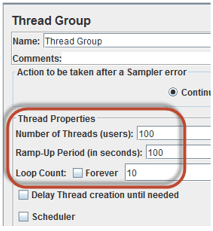
Then add a thread group by clicking on the test plan. Choose add and click on the thread. Choose a thread group from the user list. The thread group depends on the load test by the number of loops, number of threads, and period of a ramp-up in seconds.
The user who tries to simulate JMeter comes under several threads and the number of loops depends on the number of tests executed in JMeter. The ramp-up period is calculated with the time left for every new user created by JMeter.
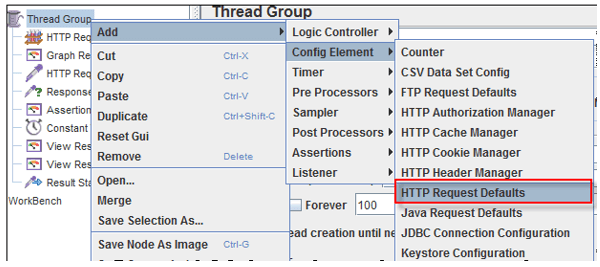
To add a default HTTP request, the configuration elements must be set in the test plan. Right-click in the thread group, choose to add. In the config element, choose HTTP request default. Give the IP or server name which needs to be set as the default server.
The user needs to add HTTP cookie manager to the thread group in the webserver by choosing HTTP cookie manager in the config element.
An HTTP request sampler is added in the thread group under the sampler option. It denotes the page request where every thread or user is accessed at the time of the test. Different requests can be added where all threads have the property to behave as individual requests.
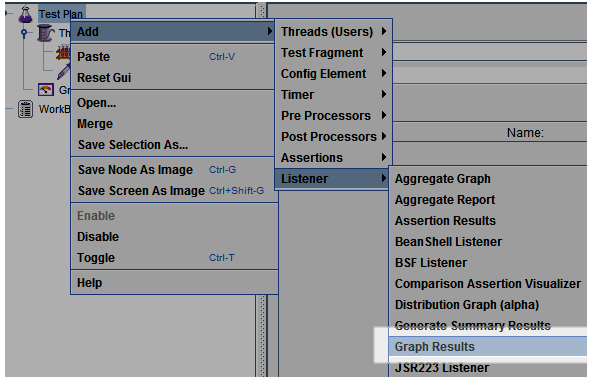
To view the graph results, select the test plan choose listener, and give graph results.
JMeter testing roadmap examples
Execute the test and analyze the results:
Once the test plan is ready, execute it to fetch the results.
Save the test plan and give an appropriate file name.
Choose view results in the table option and select run in the main menu.
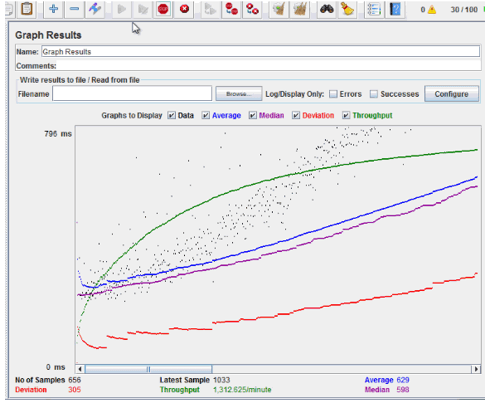
The following color-coding shows the below results:
- Black represents the sent number of samples
- Blue represents the average of sent samples
- Red denotes the standard deviation
- Green signifies the throughput rate (number of requests, the server processed per minute)
Result Interpretation:
If the status is displayed as success then it is represented in a triangle with a green mark.
Latency is represented in a number of milliseconds calculated between the time sent by JMeter and the response received initial time.
Sample time is the addition of latency response time and the number of milliseconds taken by the server to complete the request.
Compare the result with expected values and observed values which interprets the application is working fine or not.
Conclusion
Hence, JMeter is an effective testing tool installed in an application or website to check its performance and load functionality, and the testing can be done in various environment according to the scenarios and requirements.
Recommended Articles
This is a guide to JMeter Testing. Here we discuss the Definition, What is JMeter testing, How to use JMeter testing, Examples with code implementation. You may also have a look at the following articles to learn more –
