Updated March 18, 2023
Introduction to K- Means Clustering Algorithm?
K-Means clustering algorithm is defined as an unsupervised learning method having an iterative process in which the dataset are grouped into k number of predefined non-overlapping clusters or subgroups, making the inner points of the cluster as similar as possible while trying to keep the clusters at distinct space it allocates the data points to a cluster so that the sum of the squared distance between the clusters centroid and the data point is at a minimum, at this position the centroid of the cluster is the arithmetic mean of the data points that are in the clusters.
Understanding K- Means Clustering Algorithm
This algorithm is an iterative algorithm that partitions the dataset according to their features into K number of predefined non- overlapping distinct clusters or subgroups. It makes the data points of inter clusters as similar as possible and also tries to keep the clusters as far as possible. It allocates the data points to a cluster if the sum of the squared distance between the cluster’s centroid and the data points is at a minimum, where the cluster’s centroid is the arithmetic mean of the data points that are in the cluster. A less variation in the cluster results in similar or homogeneous data points within the cluster.
How does K- Means Clustering Algorithm Works?
K- Means Clustering Algorithm needs the following inputs:
- K = number of subgroups or clusters
- Sample or Training Set = {x1, x2, x3,………xn}
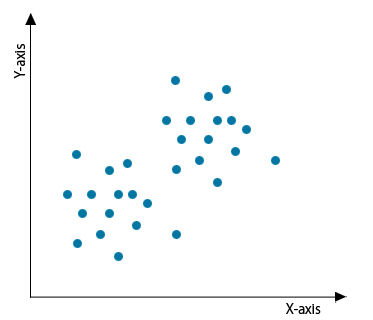
Now let us assume we have a data set that is unlabeled, and we need to divide it into clusters.
Now we need to find the number of clusters.
This can be done by two methods:
- Elbow Method
- Purpose Method
1. Elbow Method
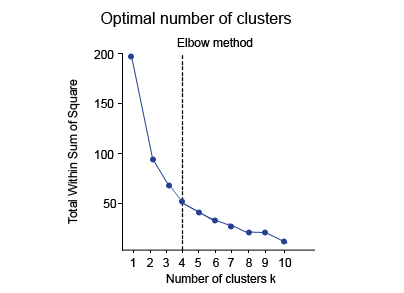
In this method, a curve is drawn between “within the sum of squares” (WSS) and the number of clusters. The curve plotted resembles a human arm. It is called the elbow method because the point of the elbow in the curve gives us the optimum number of clusters. In the graph or curve, after the elbow point, the value of WSS changes very slowly, so the elbow point must be considered to give the final value of the number of clusters.
2. Purpose-Based
In this method, the data is divided based on different metrics, and after then it is judged how well it performed for that case. For example, the arrangement of the shirts in the men’s clothing department in a mall is done on the criteria of the sizes. It can be done on the basis of price and the brands also. The best suitable would be chosen to give the optimal number of clusters, i.e. the value of K.
Now lets us get back to our given data set above. We can calculate the number of clusters, i.e. the value of K, by using any of the above methods.
How to use the Above Methods?
Now let us see the execution process:
Step 1: Initialization
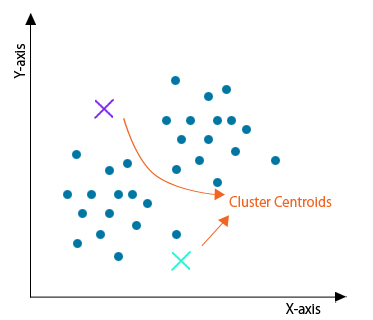
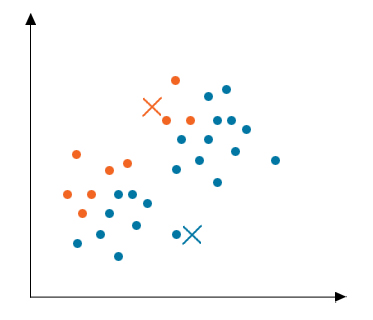
Firstly, initialize any random points called the centroids of the cluster. While initializing, you must take care that the centroids of the cluster must be less than the number of training data points. This algorithm is an iterative algorithm; hence the next two steps are performed iteratively.
Step 2: Cluster Assignment
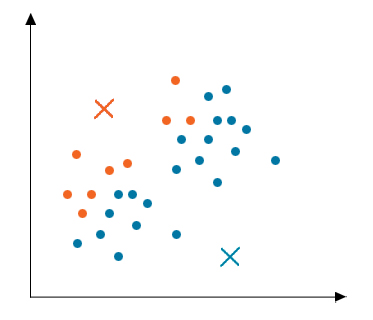
After initialization, all data points are traversed, and the distance between all the centroids and the data points are calculated. Now the clusters would be formed depending upon the minimum distance from the centroids. In this example, the data is divided into two clusters.
Step 3: Moving Centroid
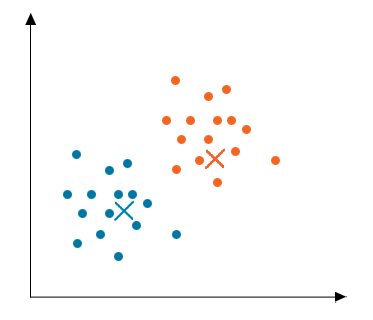
As the clusters formed in the above step are not optimized, so we need to form optimized clusters. For this, we need to move the centroids iteratively to a new location. Take data points of one cluster, compute their average and then move the centroid of that cluster to this new location. Repeat the same step for all other clusters.
Step 4: Optimization
The above two steps are done iteratively until the centroids stop moving, i.e. they do not change their positions anymore and have become static. Once this is done, the k- means algorithm is termed to be converged.
Step 5: Convergence
Now, this algorithm has converged, and distinct clusters are formed and clearly visible. This algorithm can give different results depending on how the clusters were initialized in the first step.
Applications of K- Means Clustering Algorithm
Below are the applications mentioned:
- Market segmentation
- Document clustering
- Image segmentation
- Image compression
- Vector quantization
- Cluster analysis
- Feature learning or dictionary learning
- Identifying crime-prone areas
- Insurance fraud detection
- Public transport data analysis
- Clustering of IT assets
- Customer segmentation
- Identifying Cancerous data
- Used in search engines
- Drug Activity Prediction
Advantages of K- Means Clustering Algorithm
Below are the advantages mentioned:
- It is fast
- Robust
- Easy to understand
- Comparatively efficient
- If data sets are distinct, then gives the best results
- Produce tighter clusters
- When centroids are recomputed, the cluster changes.
- Flexible
- Easy to interpret
- Better computational cost
- Enhances Accuracy
- Works better with spherical clusters
Disadvantages of K- Means Clustering Algorithm
Below are the disadvantages mentioned:
- Needs prior specification for the number of cluster centers
- If there are two highly overlapping data, then it cannot be distinguished and cannot tell that there are two clusters
- With the different representations of the data, the results achieved are also different
- Euclidean distance can unequally weigh the factors
- It gives the local optima of the squared error function
- Sometimes choosing the centroids randomly cannot give fruitful results
- It can be used only if the meaning is defined
- Cannot handle outliers and noisy data
- Do not work for the non-linear data set
- Lacks consistency
- Sensitive to scale
- If very large data sets are encountered, then the computer may crash.
- Prediction issues
Recommended Articles
This has been a guide to K- Means Clustering Algorithm. Here we discussed the basic concept, working, applications with advantages and disadvantages. You can also go through our other suggested articles to learn more –
