Introduction to Kibana Alert
Kibana alert is the new features that are still in Beta version as that time writing of the blog post. Alert is the technique that can deliver a notification when some particular conditions met. This feature we can use in different apps of the Kibana so that management can watch all the activities of the data flow and if any error occurs or something happens to the system, the management can take quick action. Actions are the services which are working with the Kibana third-party application running in the background. The applications will be email notifications, add logs information to the server, etc.
How to Get the Option of Kibana Alert?
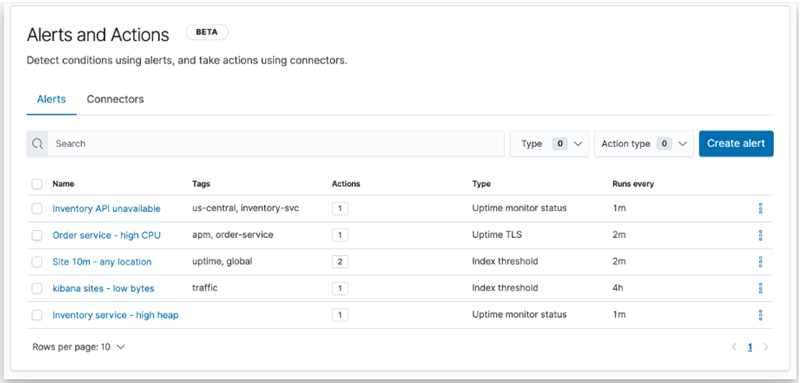
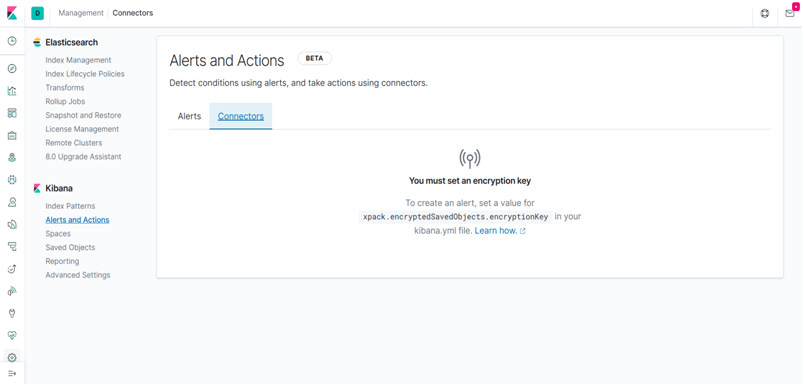
The Kibana alert option is available under the hood of the Reporting option. When we click on this option as shown in the below screenshot. We can see Alert and Action below the Kibana.
The alert has three major steps that have to follow to activate it. The details of that are given below:
- Conditions: what at which condition we want to check the condition?
- Schedule: when the particular condition has to be check for an alert?
- Actions: what action has to performed when conditions met?
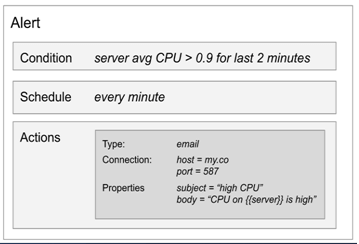
For Example: If we have a lot of servers and we want to get an alert about CPU usage more then 90% for any server then we can create an alert for that as given below an image. Hereafter met the particular conditions it will send an email related alert.
All the above steps of the alert are explained below in brief:
1. Conditions
The Kibana using the javascript methods backside of the server to detect the conditions. With the help of the javascript methods, Kibana can detect different types of conditions either running through the elasticsearch query or during the data processing in elasticsearch for the quick alert. The Kibana also giving an alert, not for the single system, it can give alert for the external system along with a cluster also.
These all detections methods are combined and kept inside of a package name alert of Kibana. User can use these methods without knowing the detection technology which is hidden from the users but only show different parameters to control the detection method.
2. Schedule
The schedule is basically for the time when the conditions have to check to perform actions. This time will be from seconds to days.
3. Actions
The Actions are the functions which are integrated with the Kibana third-party services to take action when particular conditions met.
When defining an alert we have to choose the type of alert we want to use. The main alert types are given below:
- Email: All the alerts will deliver to email.
- Index: This type uses for the indexing data.
- Server Log: This type will give information about logs through messages.
Except for the above main types there are also some more types like Slack, webhook, and PagerDuty.
Example
During the server alert type, we can map the server with the email body as shown in the below figure (body). When the particular condition is met then the Kibana execute the alert object and according to the type of alert, it trying to deliver that message through that type as shown below example using email type.
Setup of the Kibana Alert and Pre-requisites
By default there no alert activation. If you want to activate then you have to follow the following steps:
Example
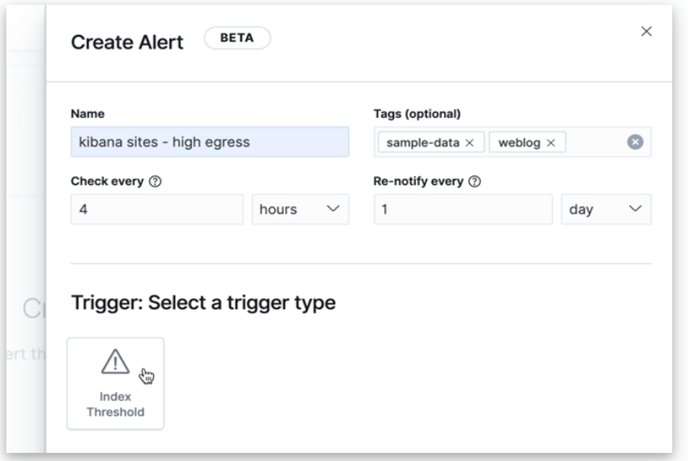
In this example, we are going to use the Kibana sample data which is built-in with the Kibana. We want to detect only those top three sites who served above 420K (bytes).To create an alert we have to go to the management site of the Kibana and fill the details of the alert and as we can see from the below screenshot, we filled alert to check for every 4 hours and should not be executed more than once in 24 hours.
Now after filling all the details, click on the Trigger option to set the trigger threshold value.
1. Index Threshold
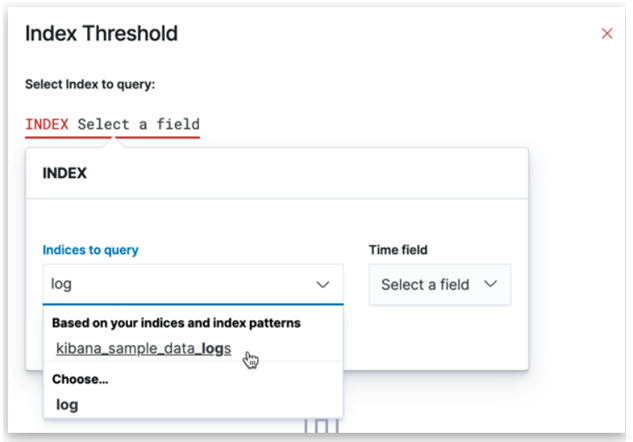
The index threshold will show all the index data-name which we can use. Like, in the below we can see that we choose the Kibana sample log data. After choosing the particular index, then we have to choose the time from the right side as shown below in the figure.
2. When Clause
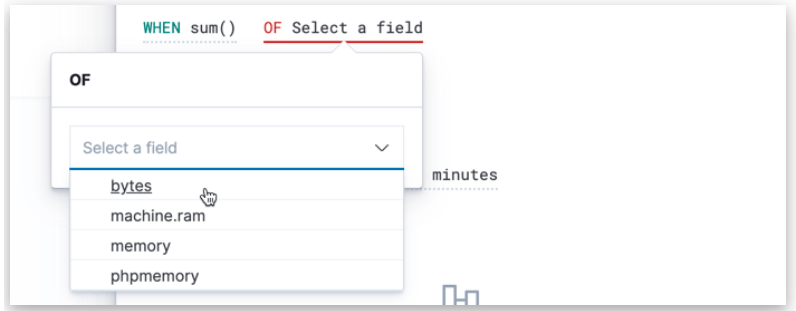
Now, we have to find out the top three websites which have data transfer in bytes more than 420K, and for this, we have to use the aggregation sum() method and choose the bytes from the list of available fields.
3. Grouped Clause
For the alert of the top three websites based on the bytes, we can do this with the help ff the host.keyword and choose the number 3.
4. Threshold Clause
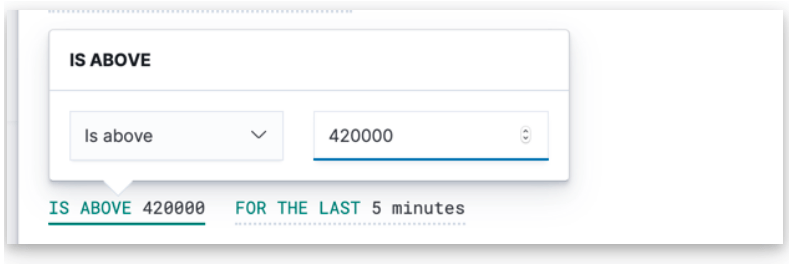
This window we will use to set up the value of the threshold as we desire the top sites have bytes transfer more than 420K within 24 hours as shown in the below screenshot figure.
5. Time Clause
The below window is showing how we can set up the window. As we choose according to our requirements for 24 hours.
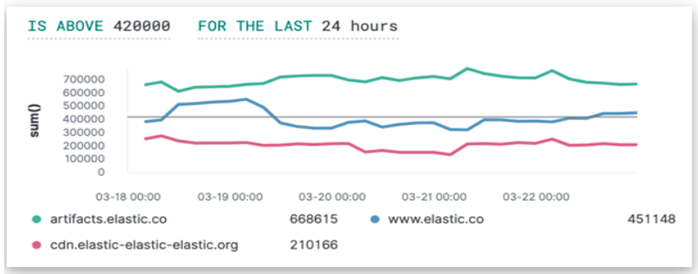
The final result will show like this:
The final preview of the result last 24 hours have more than bytes 420K
Conclusion
The Kibana alert is the best feature given by the Kibana but it is still in the beta version. The Kibana alert will help to find errors as soon as possible because of the alert system. The Kibana alert also has connectors which update the alert, create the alert, and also work as a centralized system which helps to integrate the Kibana alert with the third-party system. Kibana alert detecting condition and then trigger for action. But in reality, both conditions work independently.
Recommended Articles
This is a guide to Kibana Alert. Here we also discuss the introduction and how to get the option of kibana alert along with examples. You may also have a look at the following articles to learn more –
