Updated March 10, 2023

Introduction to Kibana Index Pattern
As the Elasticsearch server index has been created and therefore the Apache logs are becoming pushed thereto, our next task is to configure Kibana to read Elasticsearch index data. First, we’d like to open Kibana using its default port number: http://localhost:5601. To add the Elasticsearch index data to Kibana, we’ve to configure the index pattern. This will be the first step to work with Elasticsearch data. In this topic, we are going to learn about Kibana Index Pattern.
Creating the index pattern
To create a new index pattern, we have to follow steps:
- First, click on the Management link, which is on the left side menu.
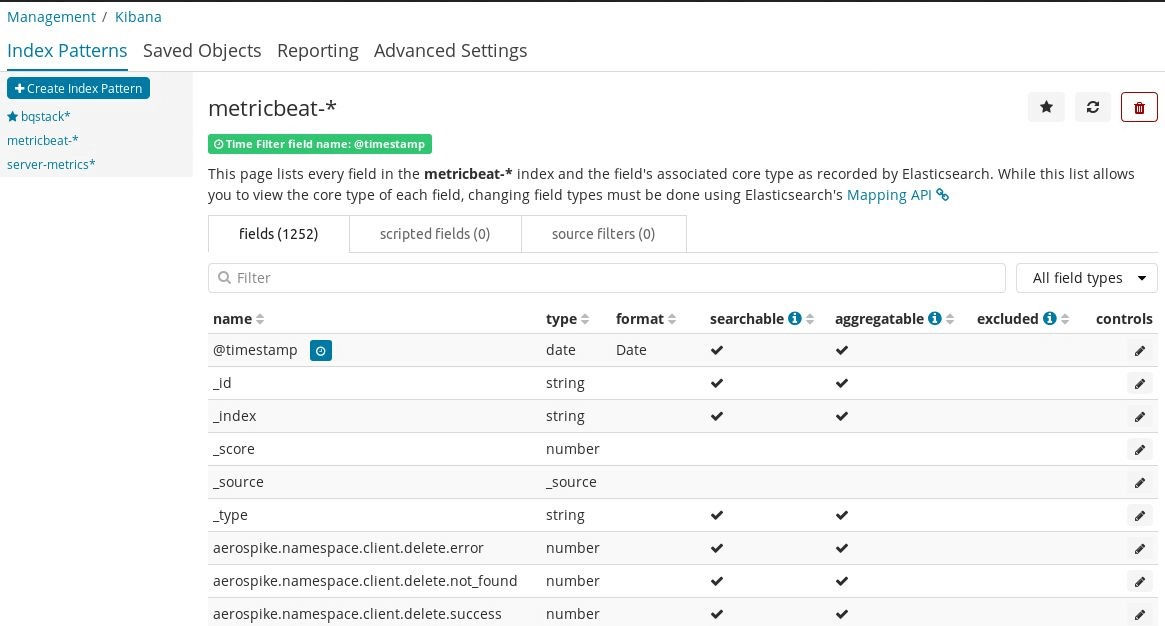
- After that, click on the Index Patterns tab, which is just on the Management tab. This will open a new window screen like the following screen:
The above screenshot shows us the basic metricbeat index pattern fields, their data types, and additional details. This metricbeat index pattern is already created just as a sample.
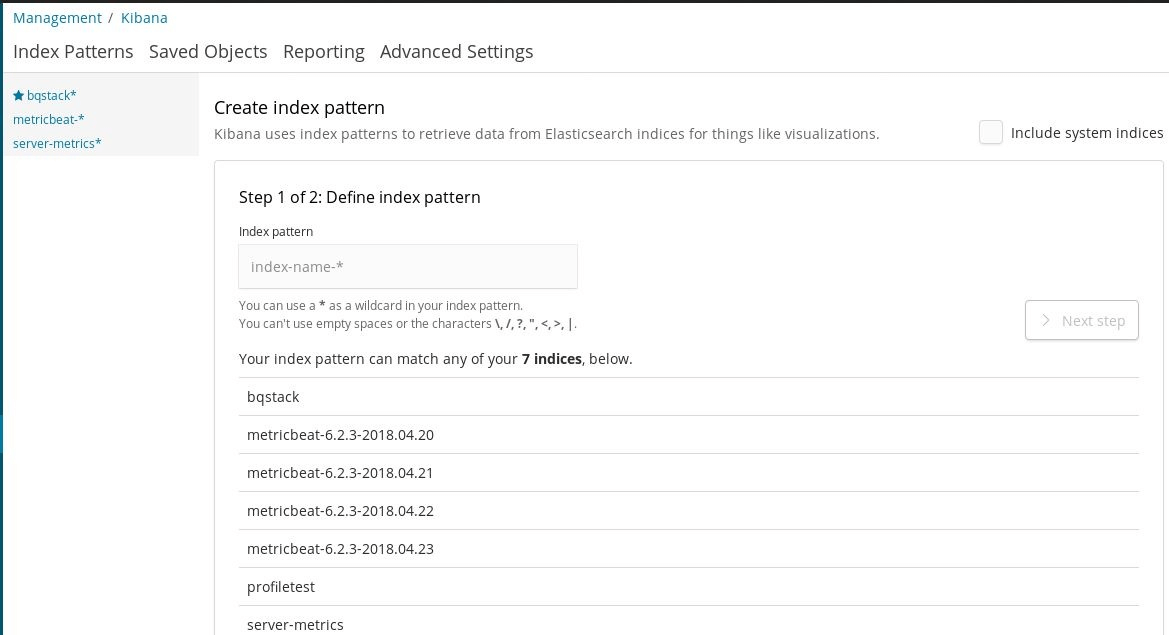
- Now, we have to click on the index pattern option, which is just below the tab of the Index pattern, to create a new pattern. This will open the new window screen like the following screen:
The preceding screenshot shows step 1 of 2 for the index creating a pattern.
- On this screen, we need to provide the keyword for the index name in the search box. Below the search box, it shows different Elasticsearch index names.
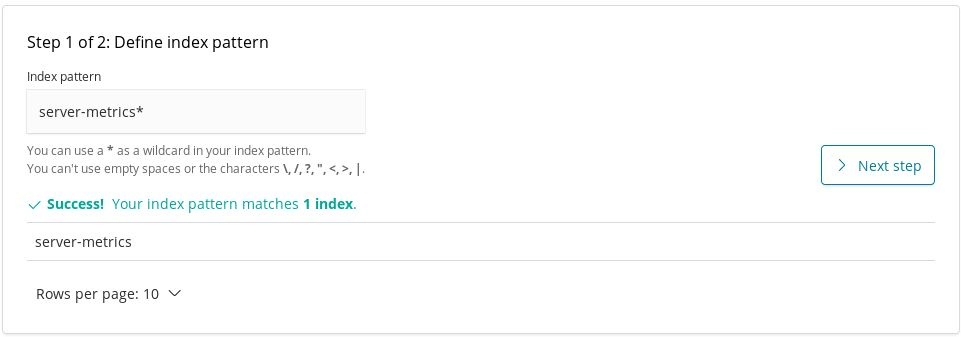
- Now, if you want to add the server-metrics index of Elasticsearch, you need to add this name in the search box, which will give the success message, as shown in the following screenshot:
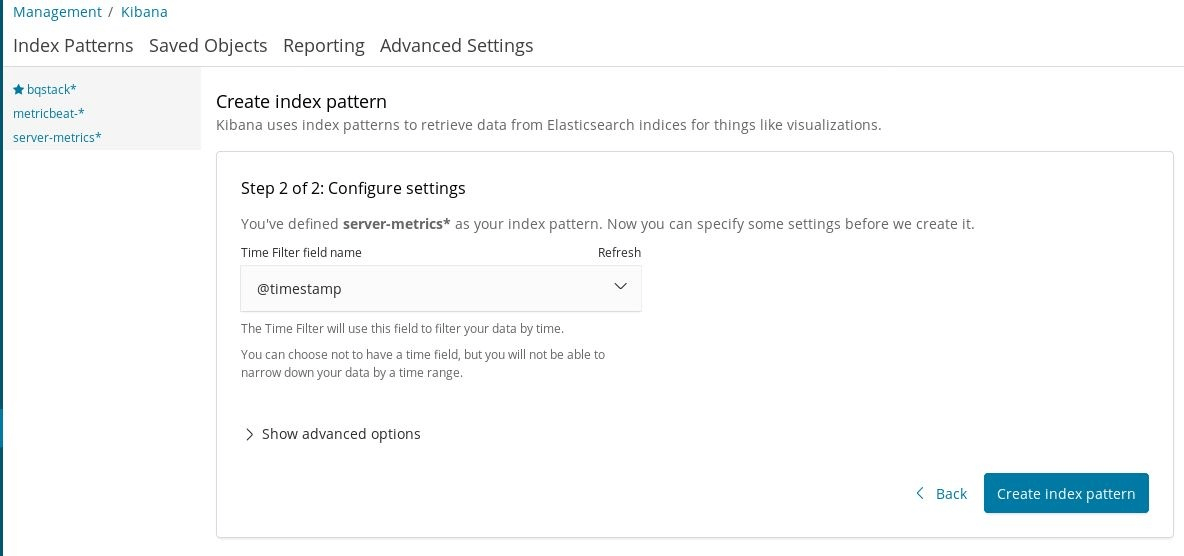
- Click on the Next Step button to move to the next step. The given screenshot shows the next screen:
The preceding screen in step 2 of 2, where we need to configure settings.
- Now pick the time filter field name and click on Create index pattern. This will open the following screen:
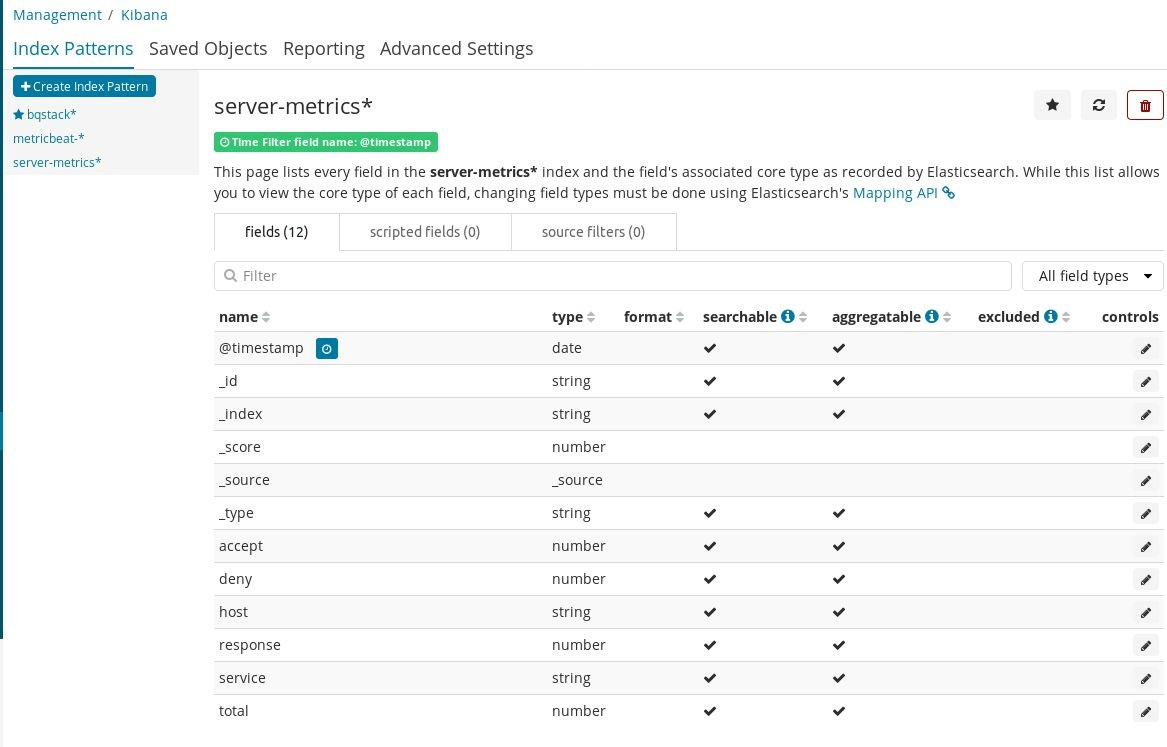
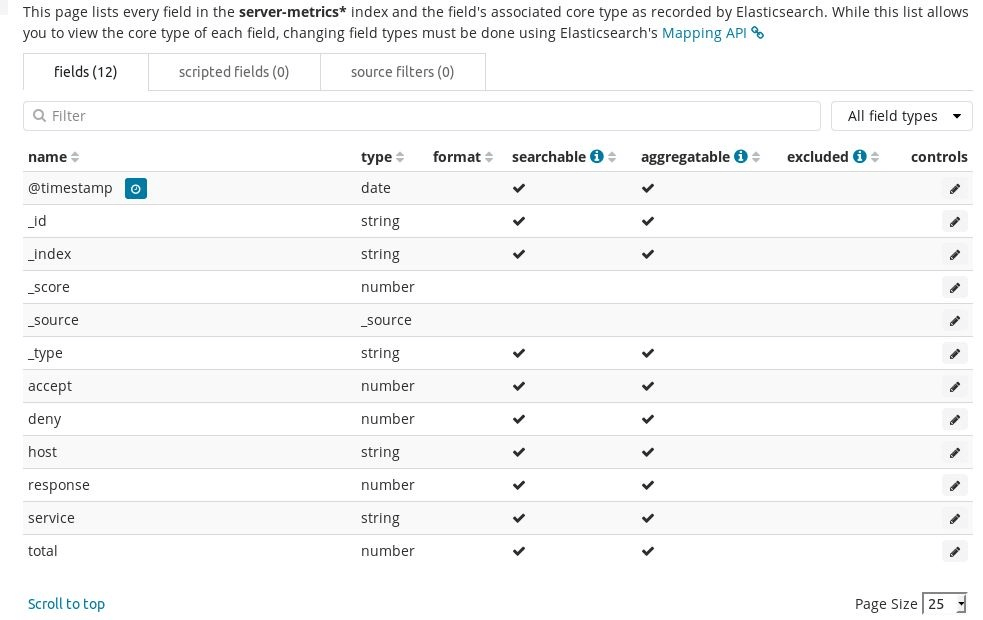
The preceding screenshot shows the field names and data types with additional attributes.
- Now we can check the index pattern data using Kibana Discover. So click on Discover on the left menu and choose the server-metrics index pattern. This will show the index data.
So, this way, we can create a new index pattern, and we can see the Elasticsearch index data in Kibana.
Setting the default index pattern.
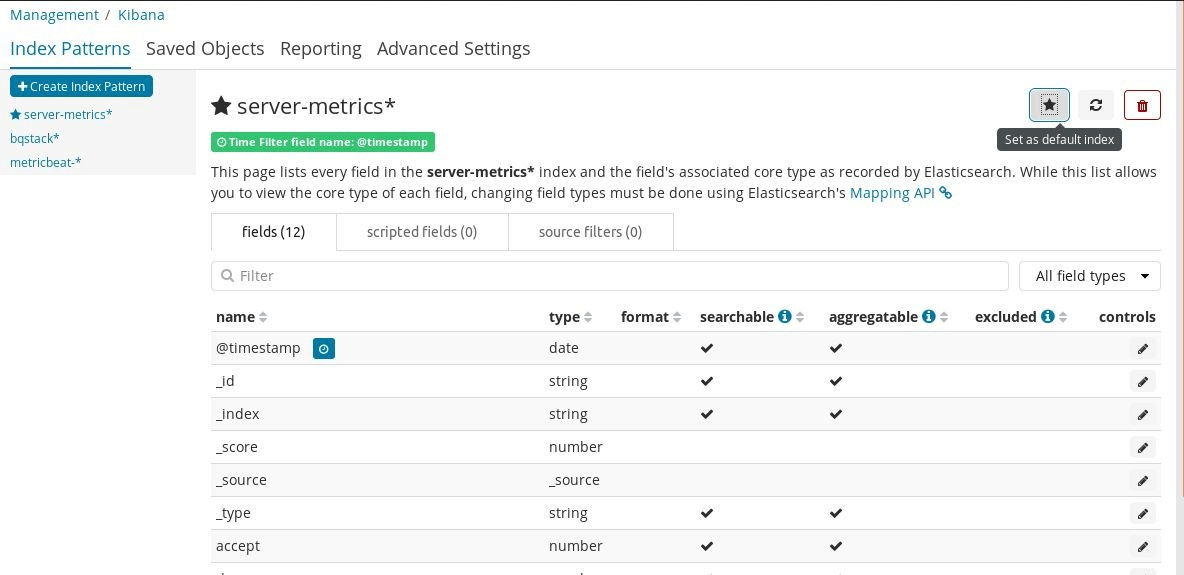
Kibana, by default, on every option shows an index pattern, so we don’t care about changing the index pattern on the visualize timeline, discover, or dashboard page. There, an asterisk sign is shown on every index pattern just before the name of the index.
To set another index pattern as default, we tend to need to click on the index pattern name then click on the top-right aspect of the page on the star image link. this may modification the opt for index pattern to default:
Refreshing index pattern fields
All fields of the Elasticsearch index are mapped in Kibana when we add the index pattern, as the Kibana index pattern scans all fields of the Elasticsearch index. However, whenever any new field is added to the Elasticsearch index, it will not be shown automatically, and for these cases, we need to refresh the Kibana index fields.
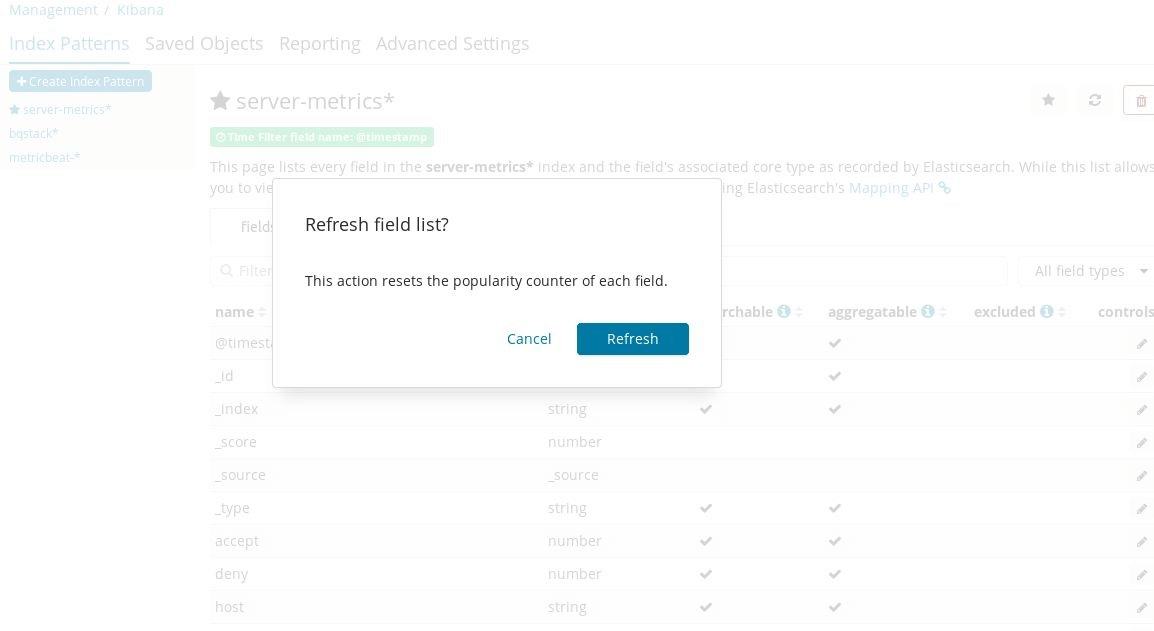
To refresh the particular index pattern field, we need to click on the index pattern name and then on the refresh link in the top-right of the index pattern page:
The preceding screenshot shows that when we click on the refresh link, it shows a pop-up box with a message. This action resets the popularity counter of each field. It also shows two buttons: Cancel and Refresh. Clicking on the Refresh button refreshes the fields.
Deleting an index pattern
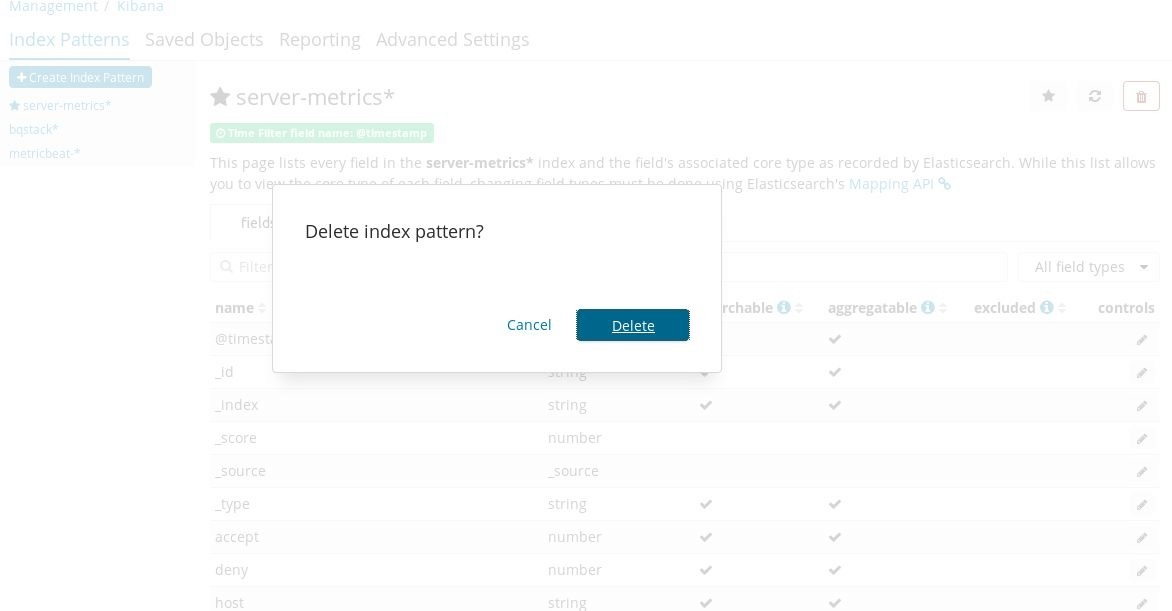
If we want to delete an index pattern from Kibana, we can do that by clicking on the delete icon in the top-right corner of the index pattern page. It asks for confirmation before deleting and deletes the pattern after confirmation. The following screenshot shows the delete operation:
This delete will only delete the index from Kibana, and there will be no impact on the Elasticsearch index.
Managing fields
Under the index pattern, we can get the tabular view of all the index fields. We can sort the values by clicking on the table header. We have the filter option, through which we can filter the field name by typing it. After filter the textbox, we have a dropdown to filter the fields according to field type; it has the following options:
- date
- string
- number
- _source
Under the controls column, against each row, we have the pencil symbol, using which we can edit the field’s properties. The given screenshot shows us the field listing of the index pattern:
After clicking on the edit control for any field, we can manually set the format for that field using the format selection dropdown. Thus, for every type of data, we have a different set of formats that we can change after editing the field.
On the edit screen, we can set the field popularity using the popularity textbox. After making all these changes, we can save it by clicking on the Update field button. We can cancel those changes by clicking on the Cancel button. Under Kibana’s Management option, we have a field formatter for the following types of fields:
- String
- Dates
- Geographic point fields
- Numbers
At the bottom of the page, we have a link scroll to the top, which scrolls the page up.
String
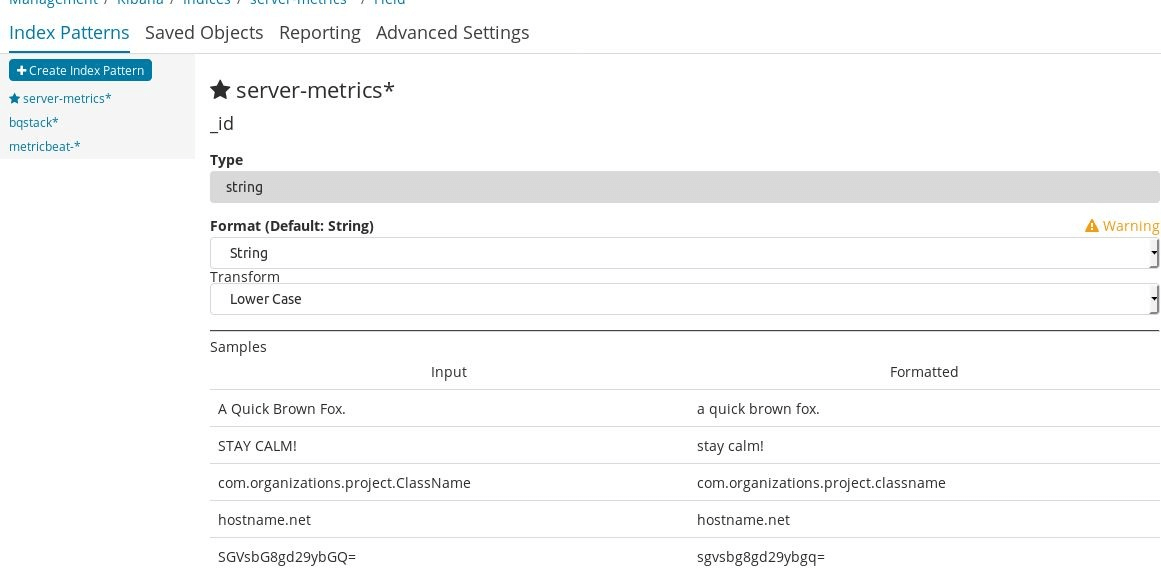
String fields have support for two formatters: String and URL. For example, in the String field formatter, we can apply the following transformations to the content of the field:
- Lower Case
- Upper Case
- Title Case
- Short Dots
- Base64 Decode
This screenshot shows the string type format and the transform options:
In the URL field formatter, we can apply the following transformations to the content of the field:
- Link
- Image
Dates
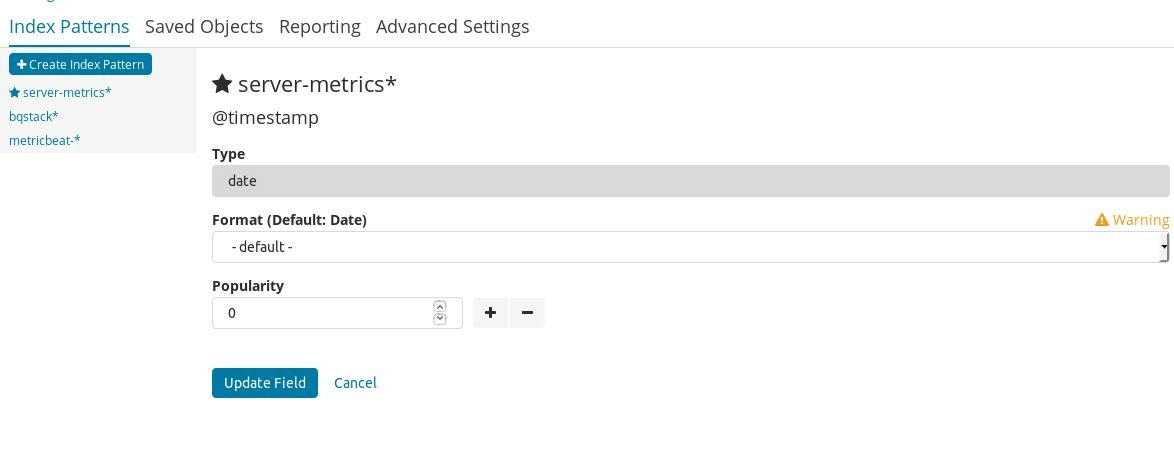
The date field has support for the date, string, and URL formatters. For the string and the URL type formatter, we have already discussed it in the previous string type. The following screen shows the date type field with an option to change the
format and popularity of the field:
The date formatter enables us to use the display format of the date stamps, using the moment.js standard definition for date-time.
Numbers
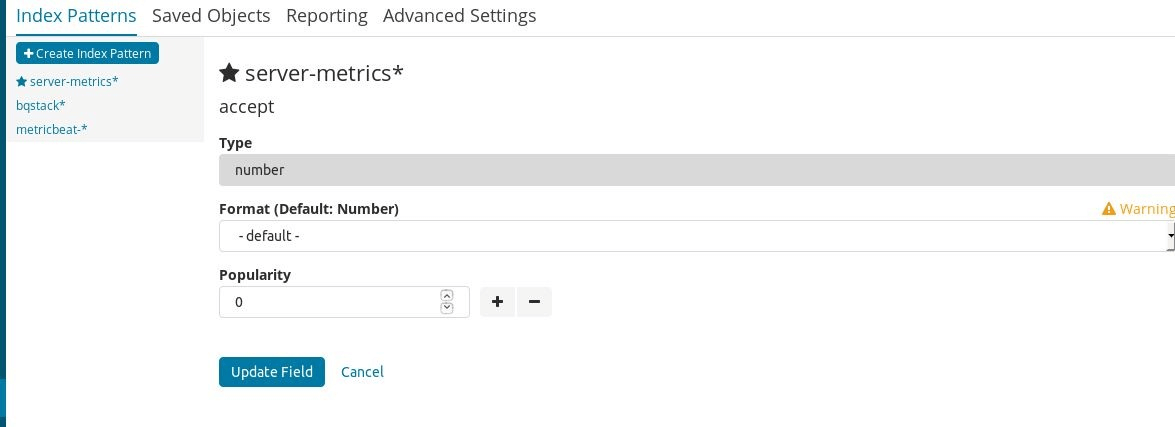
Number fields are used in different areas and support the Percentage, Bytes, Duration, Duration, Number, URL, String, and formatters of Color.
The below screenshot shows the type filed, with the option of setting the format and the very popular number field.
We can use the duration field formatter to displays the numeric value of a field in the following ways:
- Picoseconds
- Nanoseconds
- Microseconds
- Milliseconds
- Seconds
- Minutes
- Hours
- Days
- Weeks
- Months
- Years
The color field option giving us the power to choose colors with specific ranges of numeric values. We can choose the Color formatted, which shows the Font, Color, Range, Background Color, and also shows some Example fields, after which we can choose the color.
Number, Bytes, and Percentage formatters enables us to pick the display formats of numbers using the numeral.js standard format definitions.
Conclusion
We covered the index pattern where first we created the index pattern by taking the server-metrics index of Elasticsearch. After creating an index pattern, we covered the set as the default index pattern feature of Management, through which we can set any index pattern as a default. This is quite helpful. As for discovering, visualize, and dashboard, we need not worry about the index pattern selection in case we want to work on any particular index.
Recommended Articles
This is a guide to Kibana Index Pattern. Here we discuss the index pattern in which we created the index pattern by taking the server-metrics index of Elasticsearch. You may also have a look at the following articles to learn more –
