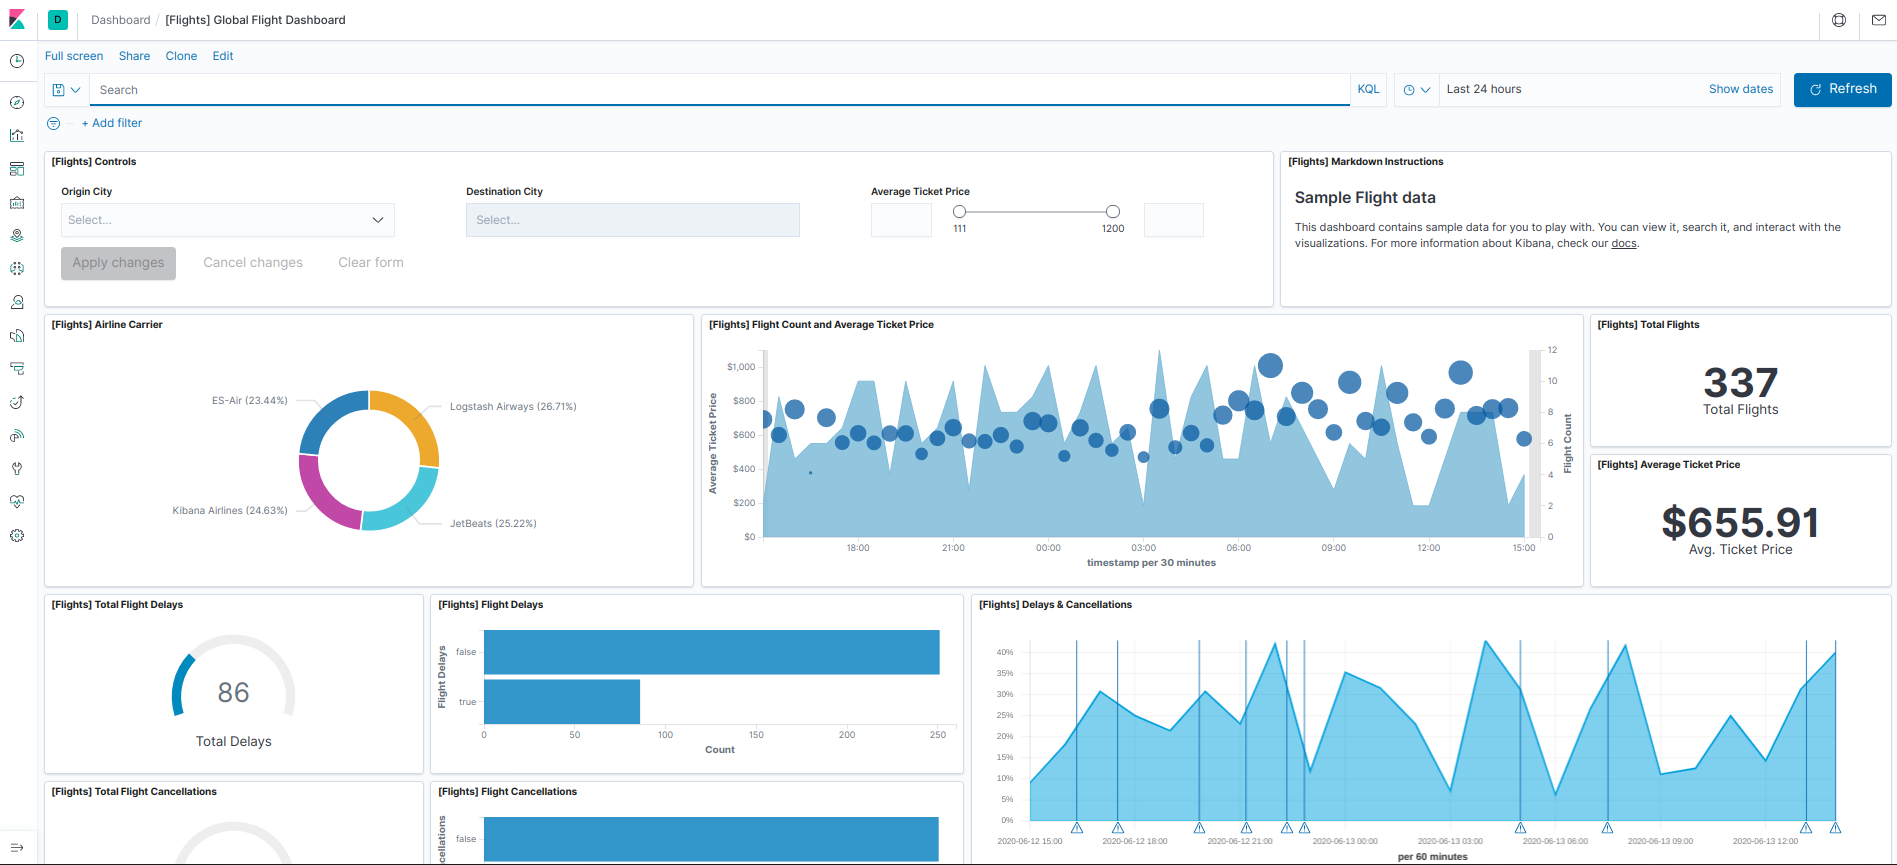
Introduction to Kibana Reporting
You can generate a report proper format including the Kibana dashboard, data visualization, and other tools which make your report more meaningful about data. We can also save our project based on the image and pdf format which depends upon the requirements of yours like either in PNG, PDF. Kibana reporting we can generate not only automatically but also manually. In this blog, we will do both generations manually and automatically. Apart from this, we can also generate a report with the help of a script and Watcher. Kibana reporting makes our analytics more powerful by seeing all data in a single place.
Kibana Reporting Tool
To find where is Kibana reporting tool available, we have to follow the below steps:
1. Open the Kibana and it will take to your first page of the Kibana.
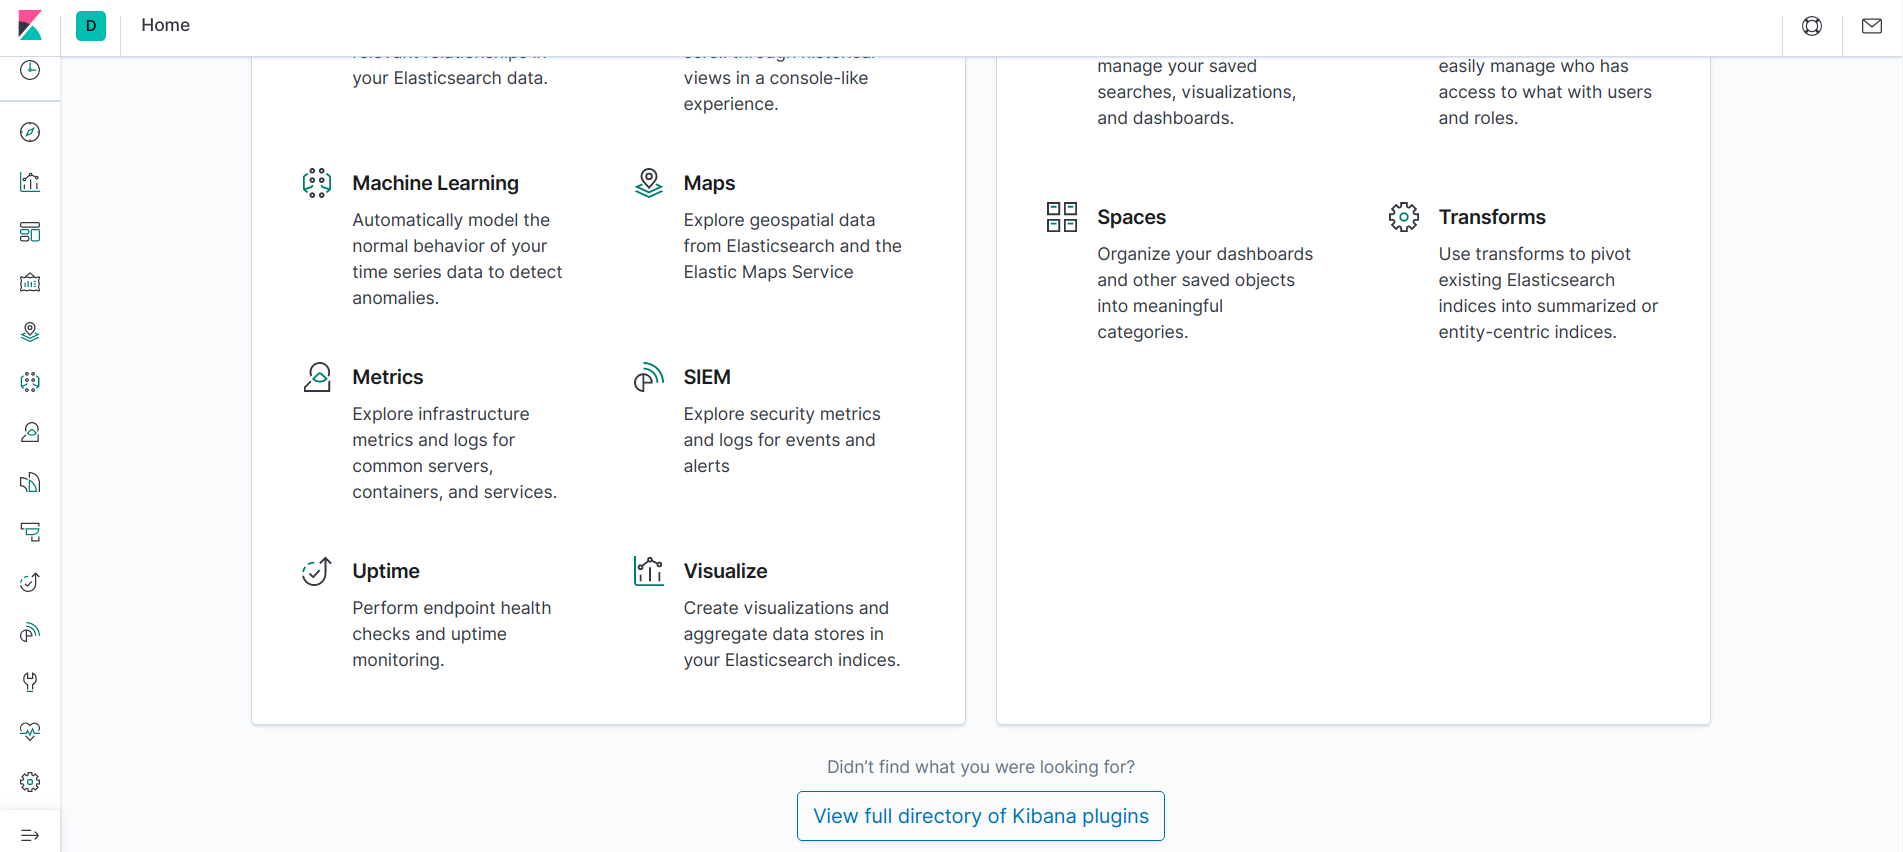
2. Then go to the bottom of the Kibana page and you will see to load more methods like screenshot showing below:
3. After click on the above link (view full directory of Kibana plugins), it will show all methods and tools which Kibana can do.
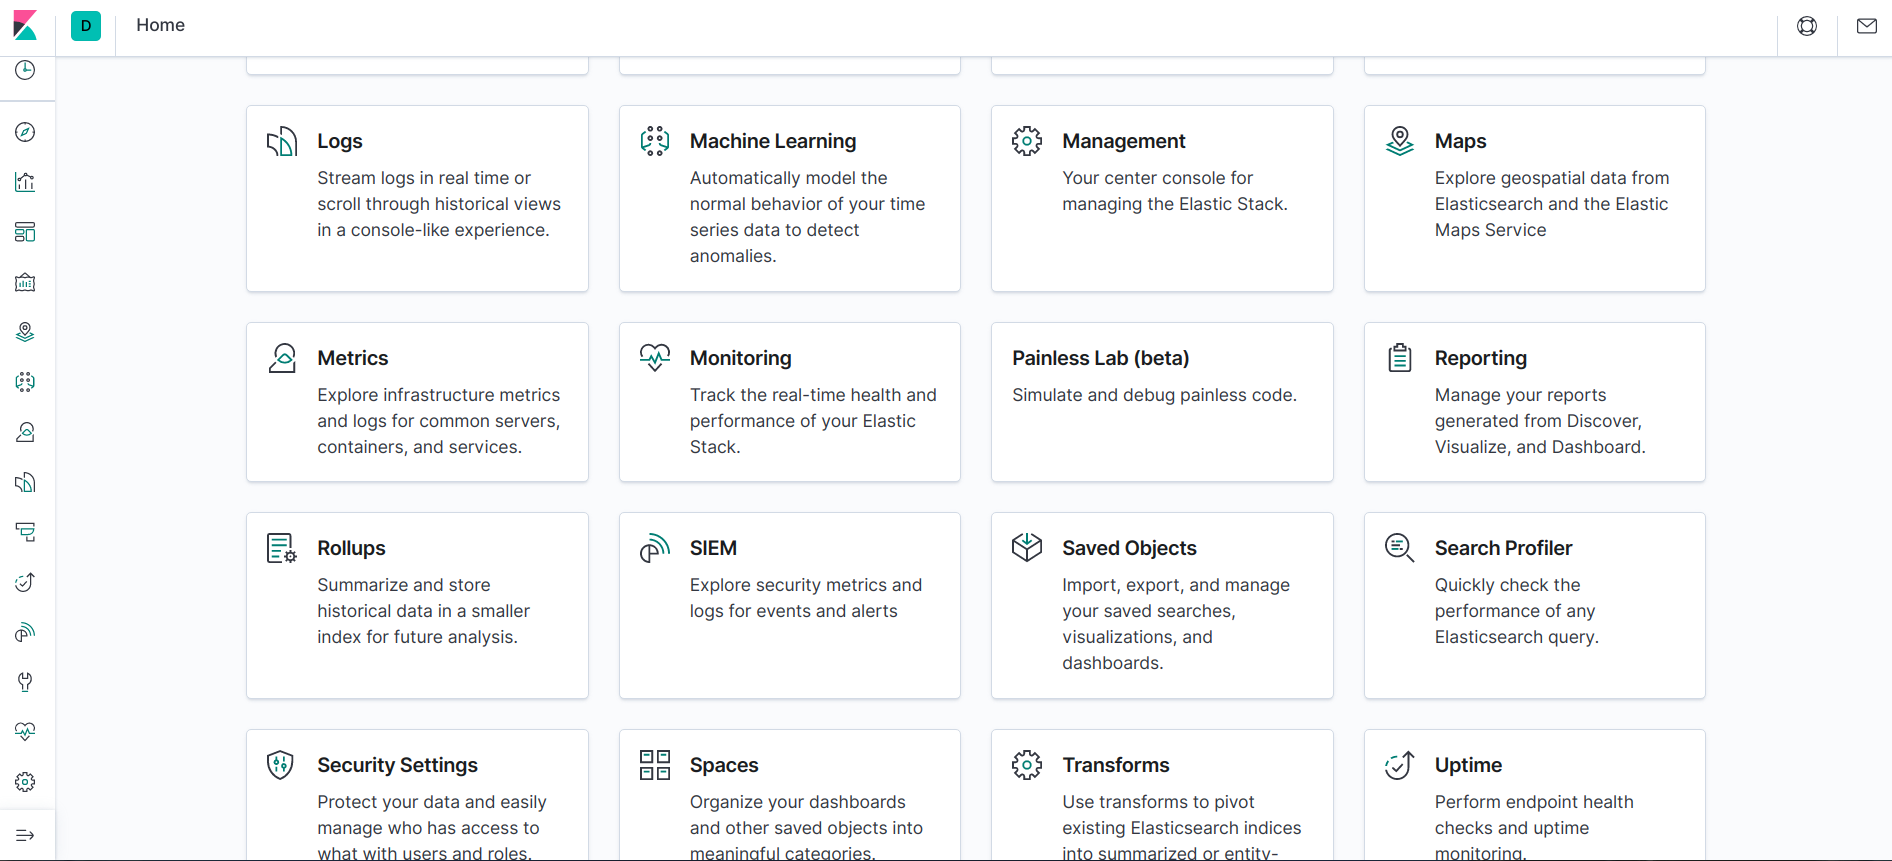
4. Now, we have to look Kibana reporting option in that as shown below in the screenshot.
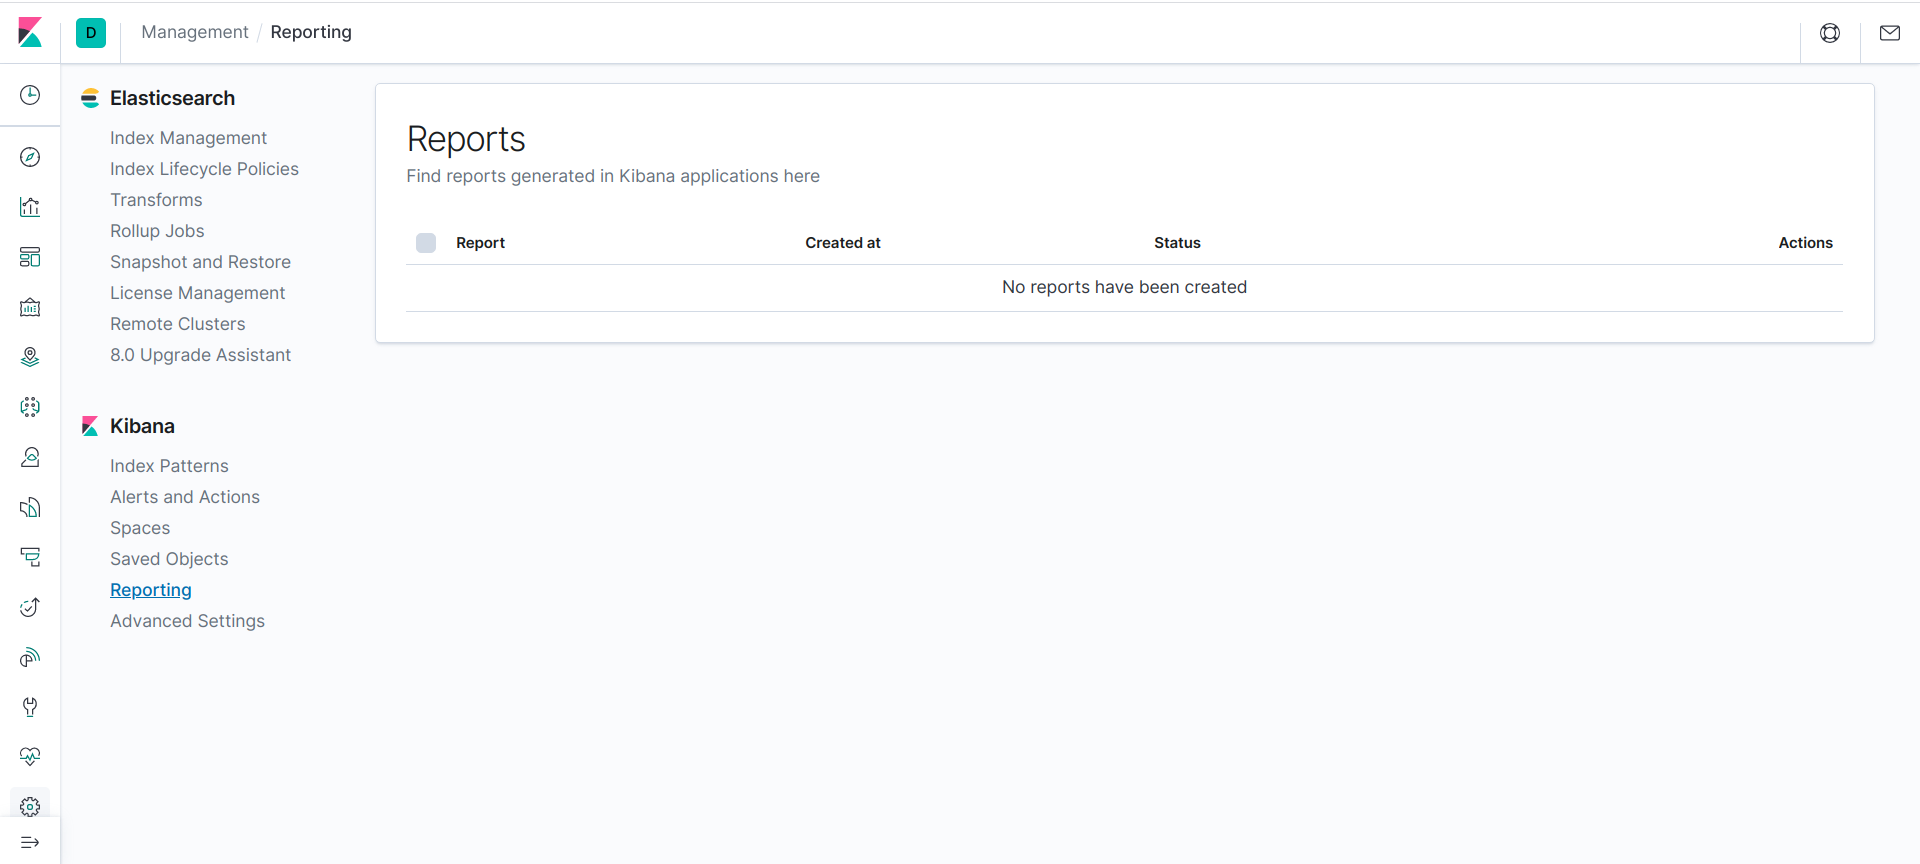
5. After click on that, we will get a window of reporting, where we can add our Kibana dashboards, visualization, etc.
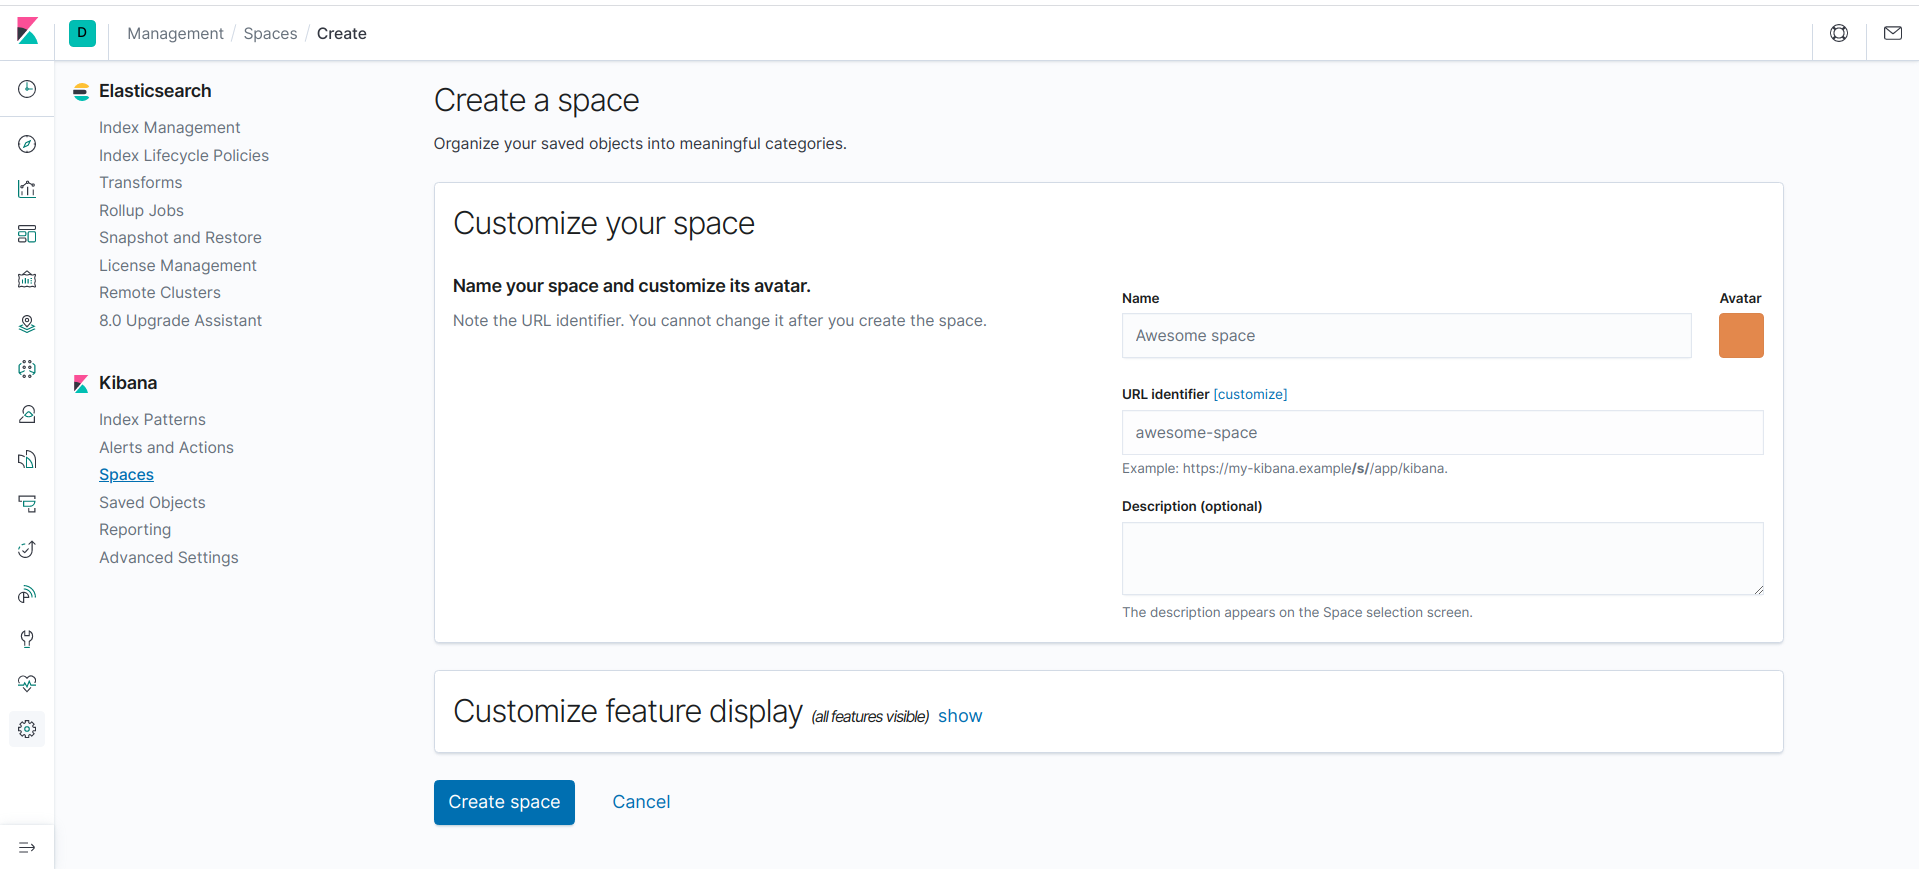
6. We can create a new report from the spaces which option available on the left side of the reporting window as shown above in fig no. 3. After click on that, we will get a new window of name to create space means here we can fill all details required for the reporting as shown below screenshot.
7. In the space window (fig. no. 4), we can see that on the right-hand side there is a Name option, where we can write the name of our reporting. We can also add images related to the report and when you click on that Avtar option, you will get an option in the drop-down like change color, upload image, etc. They’re also an option of URL which tells we can either use Kibana providing a link or can create own custom by click on that. Below the URL, there is option of description which tells about the reporting.
Features of Kibana Reporting
Below there is a customize feature display option, which provides all details of different kinds of tools charts, visualization, etc. that we can use in reporting.
1. Reporting Permission
To generate a report in Kibana, you must have a granted privilege to create a report which we called resporting_user, and also you have the privilege to access the index data which you want to create report else data will not display.
2. Creating a Manual Report
We can also create a report manually. To create a report manual we have to follow the following steps:
- Index your data and access that index in the Kibana main dashboard.
- Click on the share tab option available in the toolbar.
- We can choose the option according to our requirements:
- If we want to make a report of visualization and charts, so we can choose either Pdf or image option.
- we can also convert the whole canvas into pdf.
- We can also opt for the option of CSV.
- After finish, all requirements, just click on the generate option.
- Now we can save that file anywhere in our local system.
3. Size of the Report
The size of the report in which we generate either pdf or image form that depends upon through which we generating. If we are using canvas, then it has to determine the size before creating the report depends upon the requirements. But, if you are using any other app then might be it depends upon the size of that app like if we want to reduce the report size we can just decrease the size of the browser.
4. Automatic Report Creation
We can also create a report using POST through HTTP (with the help of the script). We can do for both PDF or CSV.
Steps to create POST link for PDF:
- Go to the visualization of the Kibana and choose the time filter option. For an absolute time we have to use the time filter option.
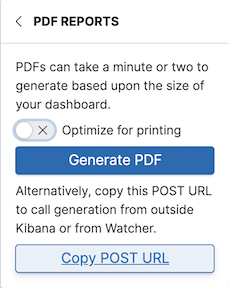
- Now the Kibana toolbar will show the share option as shown (Fig. no. 5) above. We have to choose a PDF option and create a PDF link.
- Now copy the link showing in the below screenshot.
Fig. no. 6: PDF URL link
5. Steps to Create POST Link for CSV
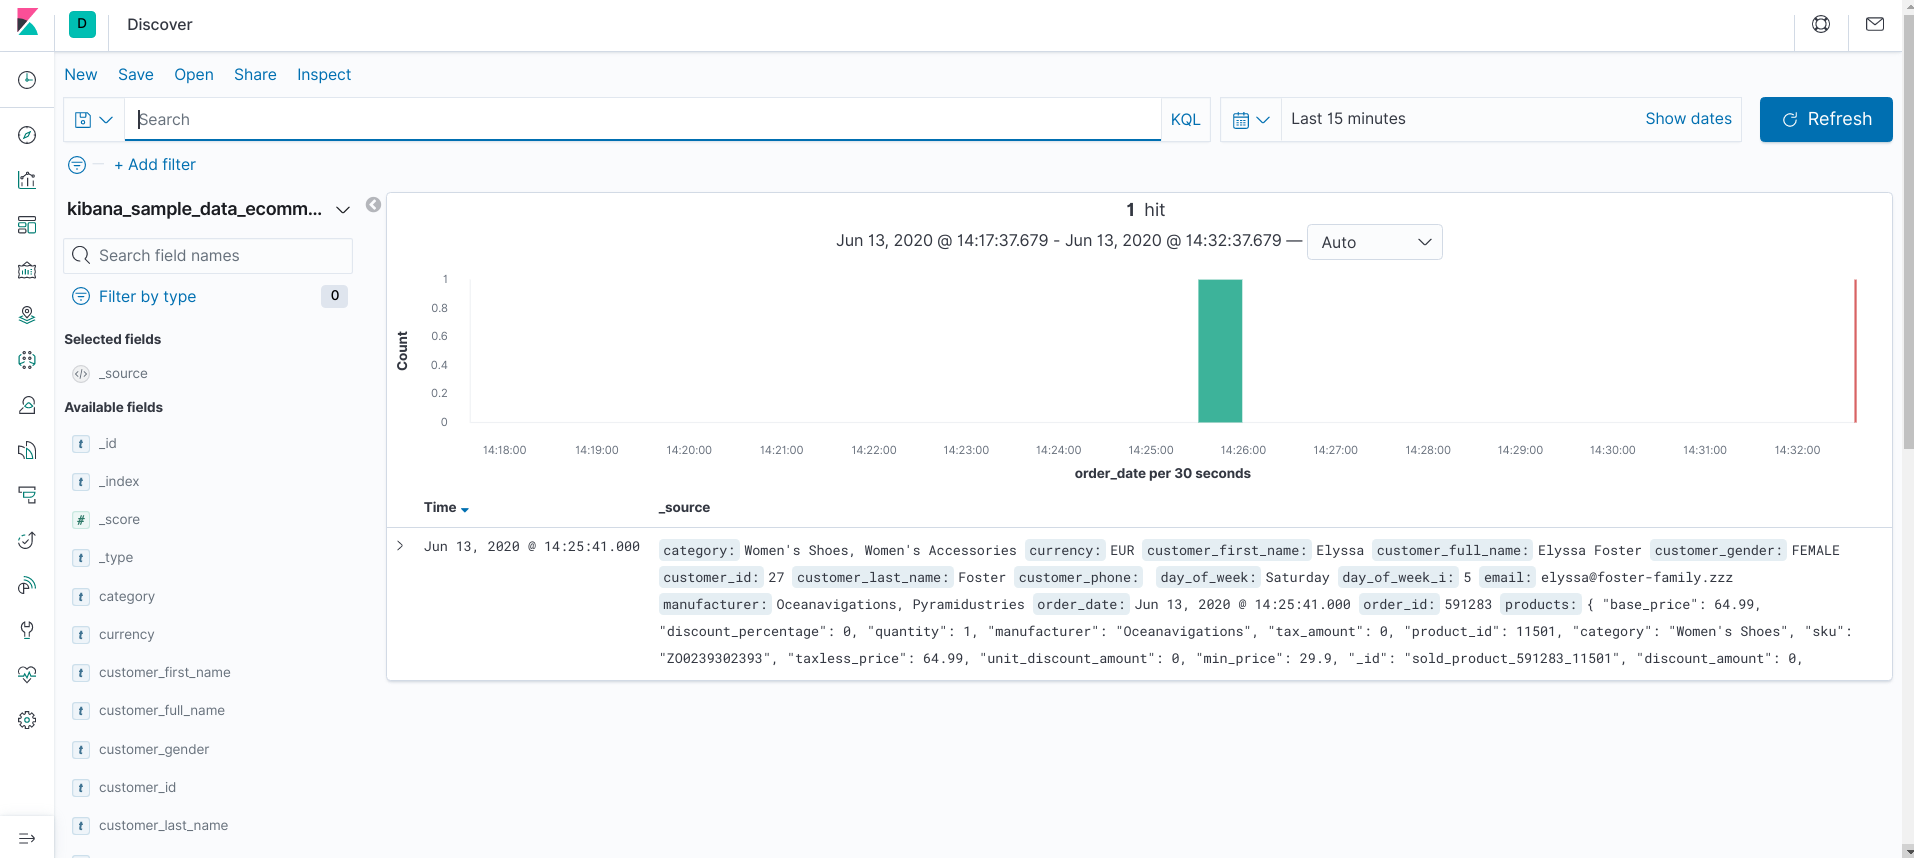
- We have to load the data from the search option and for the absolute time, we can use the time filter option. The Discover option is available in the left toolbar at the top.
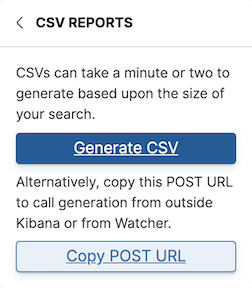
- Now the Kibana toolbar will show the share option as shown (Fig. no. 5) above. We have to choose the CSV option and create a CSV link.
- Now copy the link showing in the below screenshot.
6. Using a Script
We can also generate an automatic link for PDF and CSV through the script. This script requests a POST link and will get the result in the form of JSON and also contain a link to download the report. To get the report through a link we have to give GET request in the script itself.
Example:
curl \
Code:
-XPOST \

-u elastic \

-H 'kbn-version: 7.7.1' \

'http://localhost:5601/api/reporting/generate/csv?jobParams=...'
Here kbn-version is telling what version we are using currently. And -u elastic will check grant permission of the user to create a report. XPOST is basically for the POST.
Final report result:
After we have done all activities of reporting then our report will look like this. I just uploaded the saved projects. You can see a lot of saved projects which option is shown in fig. no. 3 left side.
Conclusion
The Kibana reporting option is very awesome to visualize all things in a single place to decision making. It has a lot of features that you explore while going through the above mention methods. Kibana has also another option to create reports automatically using Watcher. For that, we have to link the Watcher certificate to the Kibana, so that it can access Watcher.
Recommended Article
This is a guide to Kibana Reporting. Here we discuss the Introduction to Kibana Reporting and its tools along with different features with example. You can also go through our other suggested articles to learn more –
