Updated April 17, 2023

Introduction to Linux traceroute
traceroute in Linux is a command which enables the system to map the journey of the packet which contains information from source to destination. This method is very helpful in modern times in order to keep a track of the millions and millions of data transacted at each second. With this enormous data transaction, it is nearly impossible for the human mind to keep track and that is where this command in Linux will enable users to undertake various audit trails. The ones which have been successfully transacted can be notified and kept aside, but the ones where there is a data loss will require the trace to happen for the loss and be rectified. So, one can easily understand the gravity of the utilization of this command.
Syntax:
The underlying syntax of traceroute used in Linux:
traceroute [OPTIONS] <host address> [packet length]In this syntax, traceroute is the keyword that invokes the command to perform the action of traceroute, [OPTIONS] is an optional parameter that might or might not be required as per the requirement of the utility. In the <host address>we would be entering the address where we would need to trace the journey of the flow. [packet length] is again an optional parameter for specifying the size of the UDP (User Datagram Protocol) packets that need to be sent in order for the tracing to work effectively. In the [OPTIONS] in traceroute, we have multiple options which can be chosen as per the requirement of the developer.
How does traceroute work in Linux?
The complexity of tracing a route of a packet moving from source to destination depends on the number of interactions that packet has to face in the route. For an instance, in case a LAN is been used, the path traversed might be somewhat simple. The LAN might comprise of a server and at the max, 2 routers. But what if WAN is used, there is presence of different locations, numerous routers, and gateways. In using traceroute, there are suites of TCP/IP protocols that are used. Using these protocols, User Datagram Protocol (UDP) packets are sent for analyzing the route which would be taken.
The headers of this protocol comprise of TTL (Time to Live) field, which limits the lifespan of data in the network. In contrast to the name, this TTL field signifies counter and not time. Now, in a route, an UDP’s header would comprise of the TTL value and as soon as a packet is received at the router, the value in the TTL is decreased. Now, in the process, as the value keeps on decreasing when reaches zero, the packet will be discarded and then the next hop on the journey will no longer be possible and hence we would sometimes see a message saying, “timed out”. Now that the router sends a message containing timed out, it will contain the original header and along with it contain the first 64 bits of the original data of the packet.
Now the question is how would traceroute know what the minimum hops or TTL value are that would be required for reaching the destination. As an iterative process, the traceroute will start sending UDP starting with TTL value as 1, till either the packet has reached the destination or the maximum value of hops allowed is reached, i.e. 30.
Examples of Linux traceroute
Now, we will look at how do we interpret the output of the traceroute.
Example #1
Tracerouting google.com
Code:
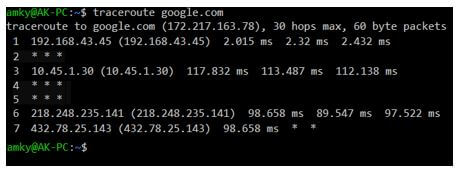
traceroute google.comOutput:
In the output, the first line has the following information:
- Destination of the packet along with its IP address.
- The maximum number of hopes allowed by the command traceroute.
- UDP packet length that is sent for tracing the path.
In the following next lines, each line signifies the hop addresses in the route.
In each of these lines we would get the following information:
- The device name or the IP address in case the device is not able to identify itself.
- IP address in the bracket. In case the first item is IP address this item will be the same as the first item.
- The round-trip time that was taken for each of the 3 tests. In this element, if an asterisk is present, it means that there was no response for the test. For no response in the device, you would be able to see 3 asterisks with no device name and IP address.
Example #2
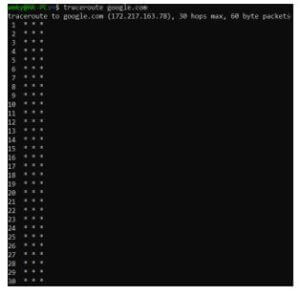
Router not responding
Code:
traceroute google.comOutput:
Now, it is time for us to look at various options that are available with traceroute along with examples wherever applicable. Be informed that the list of options is not an exhaustive one and has the ones which are mostly used in the industry.
| [Option] | Utility |
| -f | This option is to set the TTL value which is set for the first probe packet. |
| -d | This option will enable socket level debugging. |
| -I | This option is for using ICMP ECHO instead of UDP data. ICMP is used when one needs to carry network status data and not application data. |
| -m | This option is used for setting up the maximum TTL for the outgoing packets. By default, this is set to 30. |
| -p | Using this option one can set the port number associated with UDP. By default, this number is 33434. |
| -w | This option is used to allow the system to wait for a response. By default, this value is 5 s. |
| -z | This option is used for setting time required for pausing between probes. |
| -s | This is done to include a particular IP address and not expose the actual source address in the outgoing packet. |
Conclusion
In this article, we saw different elements of traceroute command along with the way of interpretation of the output of the command along with different options that are available with the traceroute command. One should be wary of the fact to no bombard unknown devices with UDP packets and usage of traceroute in scripts and unattended jobs though we all have already seen the utility of this tool to investigate network routing, connection speed checking, and, hence identifying bottlenecks.
Recommended Articles
We hope that this EDUCBA information on “Linux traceroute” was beneficial to you. You can view EDUCBA’s recommended articles for more information.


