Updated March 16, 2023

Introduction to Logstash Monitoring
Logstash monitoring is the feature available in Logstash, which can be used to get more detailed information about the internal working, processing, and health of the instances running in the background of Logstash inside the system’s environment. This article will look at what monitoring is and how it works. We will also have a detailed discussion on What monitoring is, Why monitoring, monitoring Configuring, monitoring page, and a Conclusion about the same.
What is Logstash monitoring?
To get more insights about the ongoing running instances of Logstash and their health, we can use the Logstash monitoring feature. Many runtime metrics are captured by Logstash as soon as we execute or run Logstash in our system, which can be further used for getting the data for monitoring various aspects, including the performance and health of the deployment being made by us for Logstash. The below section list outs all the metrics that Logstash collects for monitoring –
- Information related to nodes of Logstash includes Operating System information, settings of the pipeline, and information about the Java Virtual Environment (JVM).
- Information related to the plugins includes the complete list of the plugins installed in the system.
- Information related to Hot threads.
- Stats information related to nodes, processes, JVM, stats related to any events, and the runtime stats of pipelines.
Monitoring APIs can be used to get the information about all these metrics provided in-built by Logstash. We do not have to perform external configurations for using the same as the availability of these APIs is done by default in Logstash. The APIs provided by Logstash for monitoring the metrics during runtime are as listed below –
- Hot thread Application Programming Interface (API)
- Plugin’s information Application Programming Interface
- Node Stats Application Programming Interface
- Node information Application Programming Interface
An alternative solution to using APIs is to use X-pack to monitor various metrics of Logstash and transfer the data related to metrics to the monitoring clusters, but this needs some configuration to be made for its usage.
Why Logstash monitoring?
Monitoring is important in collecting all the data related to monitoring using various metrics and transferring and sending them to their respective monitoring clusters or other specified destinations.
The things we need to be careful about priorly before we go for monitoring include the specification of the cluster uuid, which will act as the target. Doing so is optional, but you compulsorily disable the collection created by default to monitor metrics. Further, it would help if you go for installation and configuration of the required plugin or extension, such as metric beat, which will help collect data related to monitoring.
Logstash monitoring Configuring
To configure the monitoring in Logstash, we will have to check whether the monitoring is enabled for the specific Elastic search cluster we are working on and if not, then make it enabled. We can get the details of uptime and the usage of memory along with all the sent and received events by Logstash in the overview section of the dashboard. Further, to get the metrics of Logstash, we can go for the configuration of either of the methods mentioned below –
- Collection of Metric beat – The task of the Metric beat is to get the data related to monitoring from the instances of the Logstash, assemble it, and then further forward it to the clusters of monitoring directly. One of the most important advantages related to the metric beat collection is that even though the instances of Logstash are still inactive, the monitoring agent stays active doing its job.
- Deprecated methodology of the legacy collection – Production clusters receive the data related to monitoring from the legacy collectors when following the methodology of the legacy collection, which is deprecated usage as of now.
Logstash monitoring page
When using X-pack in Logstash for monitoring various metrics using the Kibana platform. As discussed above, some prior configurations and installations need to be done. After that, you can follow the steps below to access the monitoring pages on Kibana.
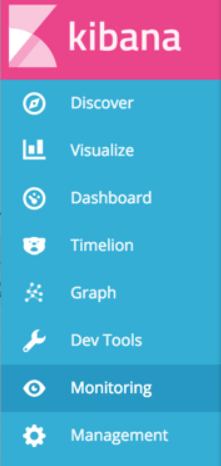
Step 1 – To access the page of monitoring, you firstly need to go to Kibana and then further move to the Stack monitoring page present on it, as shown below –
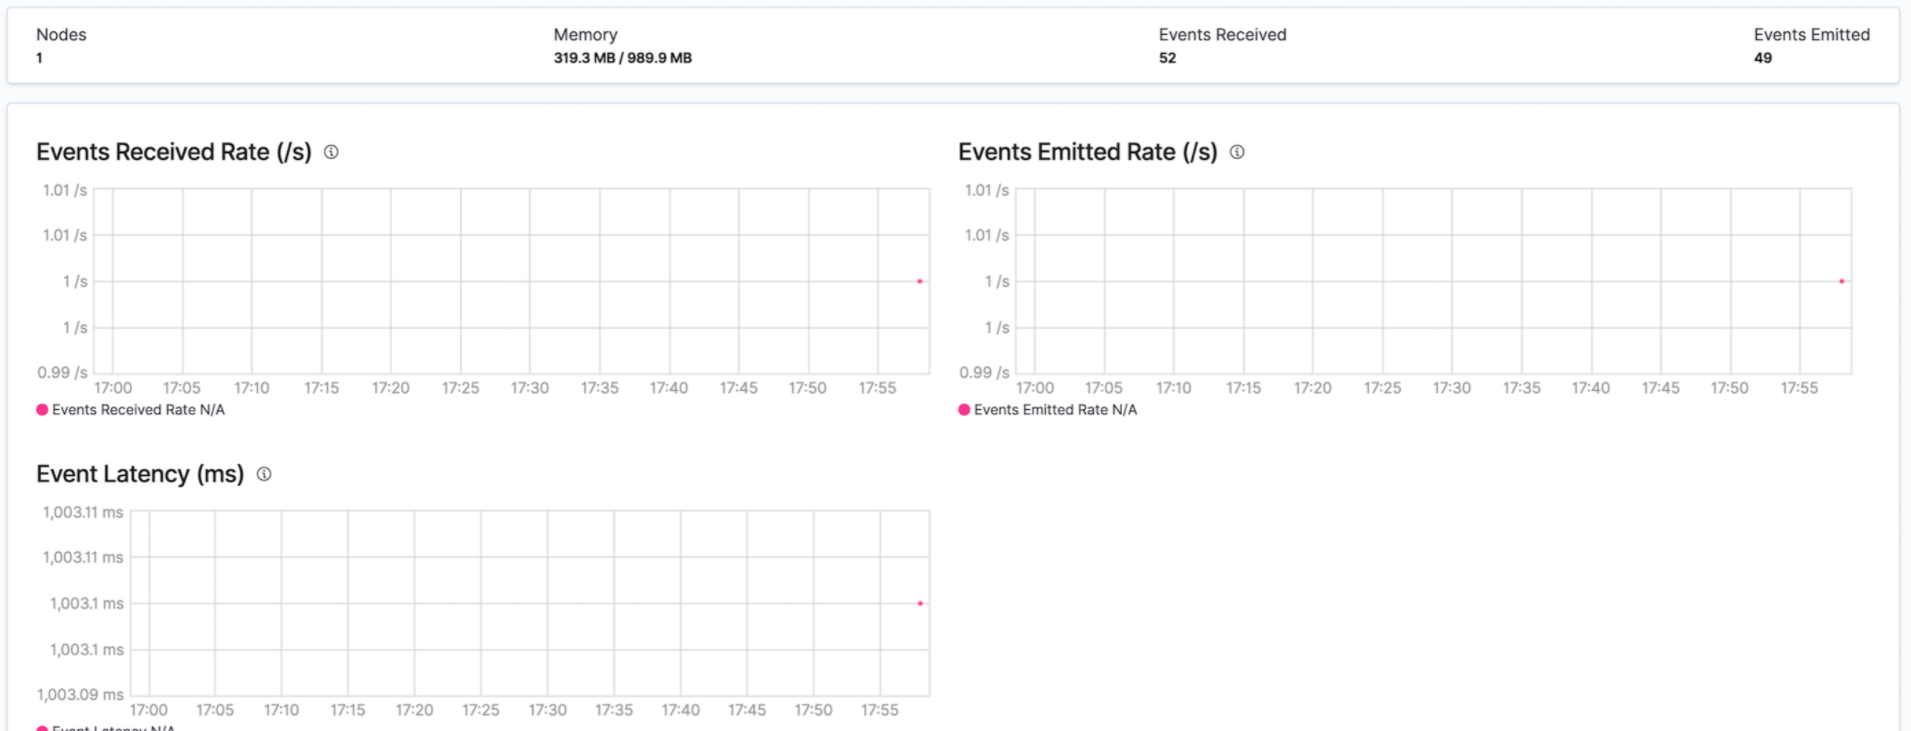
Step 2 – Over there, you will see an option of Overview, which will be present inside the section of Logstash, where you have to click “Overview.” On this page, various metrics will show you the health of all the nodes of Logstash. For example, the window will have the below structure. Values may differ as per the performance of nodes of Logstash on your system –
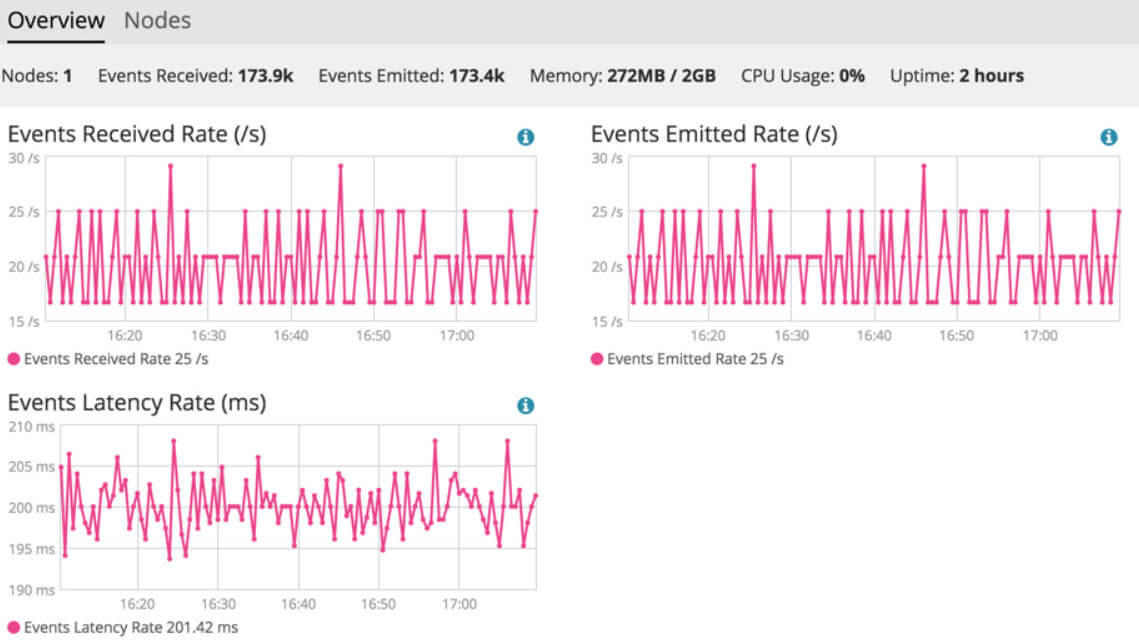
Step 3 – We can observe the metrics on the screen for our nodes as shown in the below output of Kibana and following the same steps discussed above –
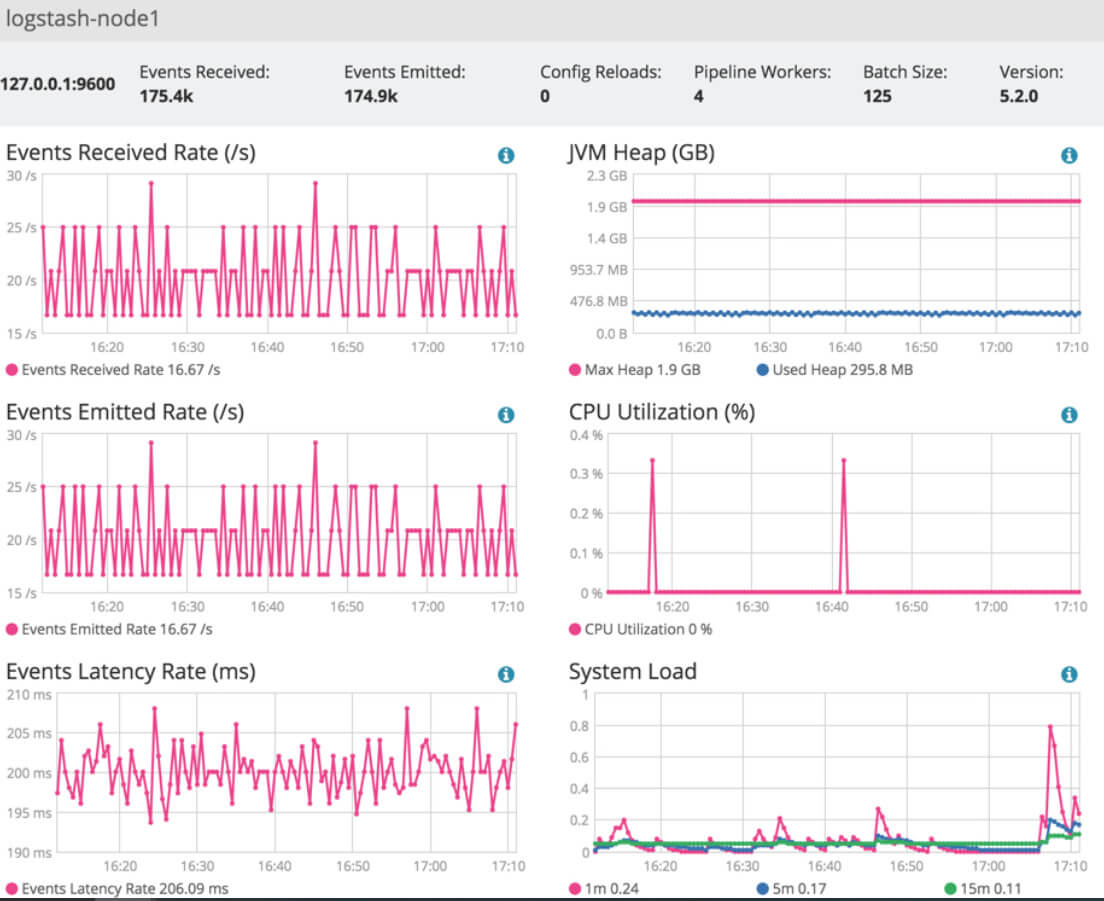
Step 4 – If you wish to check the metrics of nodes of Logstash, then you can do that by clicking on Nodes, where you can see the condition and status related to every node on Logstash.
Step 5 – You can further even hit the name of a node to get the details of statistics over a particular duration of time.
In short, to gain insights into the monitoring and performance of Logstash when using X-pack in Kibana for monitoring in Logstash, you will have to drill down to get more detailed metric values.
Conclusion
It is used for getting deeper insights into the overall health and performance of the Logstash. There are various metrics whose information we get when doing the monitoring, as mentioned in the “What is Monitoring section.” We can carry out monitoring either by using X-packs that need little configuration or using various monitoring APIs available.
Recommended Articles
This is a guide to Logstash Monitoring. Here we discuss What monitoring is, Why Logstash monitoring, monitoring Configuring, Logstash monitoring page. You may also look at the following articles to learn more –
