Updated March 20, 2023

Introduction to Lookup Function in Tableau
This article will explore the Lookup Function in Tableau. The lookup function is one of the most important and widely used table calculations in Tableau and is used to find values from a selected range. As the name suggests it is used to lookup values within a table (partition) i.e. either from the start of the partition or from the end. The value fetched is based on the offset value which defines the position (either positive or negative) from the current row. The value (measure/dimension) which needs to be looked up is specified in the syntax and the position is based on the offset. Offset is something that specifies the number of addresses which is added to the base address to get an absolute address.
Difference between Excel Lookup and Tableau Lookup
Excel also provides the lookup feature in terms of vlookup and hlookup. However, lookup in excel is used extensively to extract the values from a different table while Tableau lookup will fetch the data from within the table based on the offset values.
The syntax for Lookup function: [expression, offset]
Expression: The first part of the function is the aggregate of measure or dimension that will be returned.
Offset: This refers to the number which will specify in which direction should tableau move (Positive or negative) and by how much from the current row value. That means it specifies the position to fetch the value specified in the first part. Offset basically refers to the distance in cells from the starting of the table or from the end of the table. It can be a hardcoded number, a parameter or a formula. If the offset is a negative value it will lookup the previous rows and if the value is positive it will lookup the upcoming row’s values.
Let’s understand this topic using working examples.
Example #1
Data Source Being Setup
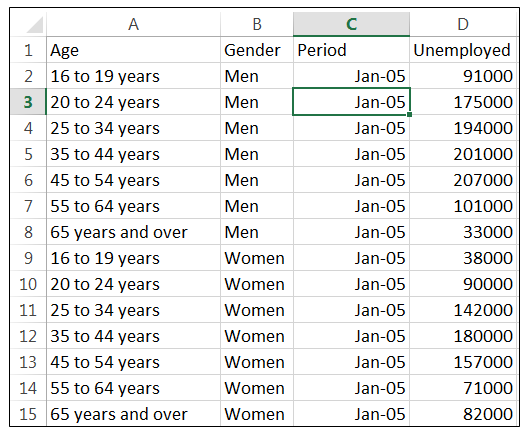
We have a sample dataset that has data about the unemployment numbers in the US for 5 years (2005-2010). It consists of unemployment numbers for different age groups for each month. The unemployment numbers are specified for both men and women separately.
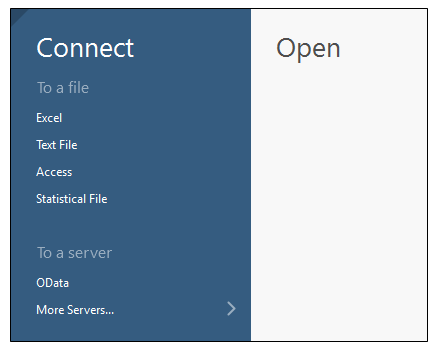
1. After launching Tableau, connect to the excel file mentioned above using the connect option on the Tableau landing page. Select the excel option and browse to your data file.
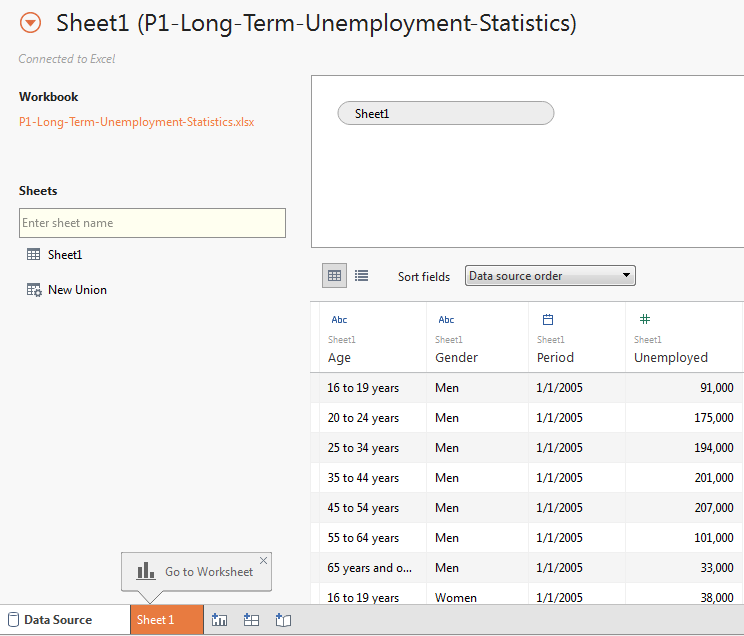
2. Once the file is selected and opened, you will be navigated to the data source view of the tableau. In the data source tab, it displays how the data source is being set up and also displays the first 1000 rows of the data. And to go to the worksheet click on Sheet 1.
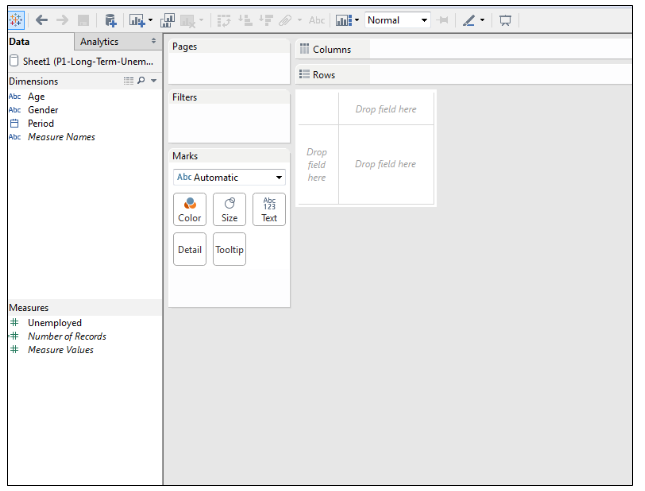
3. Tableau will automatically identify the numeric values (Measures) and the categorical value (Dimensions).
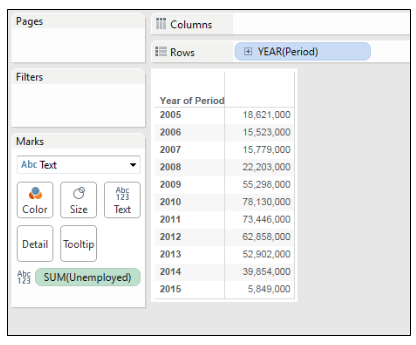
4. Drag and drop the Period value from the dimensions to rows pane. Also, move the unemployed measure over the text box in the marks pane. This would result in a table as shown in the below figure.
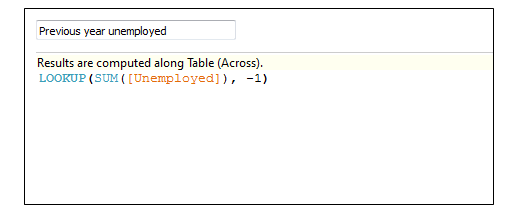
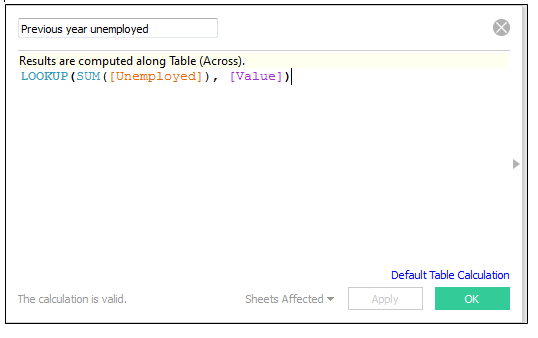
5. To introduce the concept of lookup, create a calculated field named Previous year unemployed using lookup function with an offset of 1.
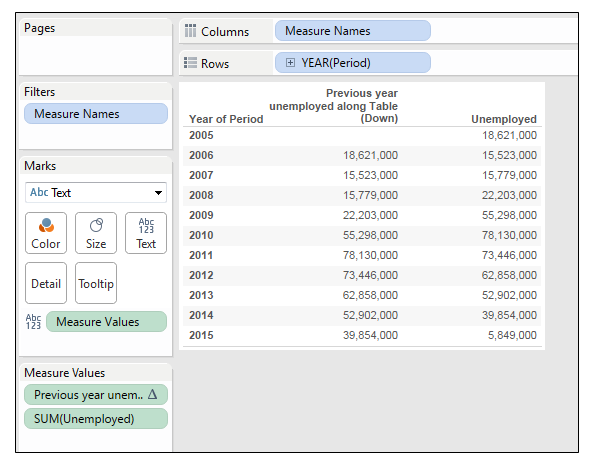
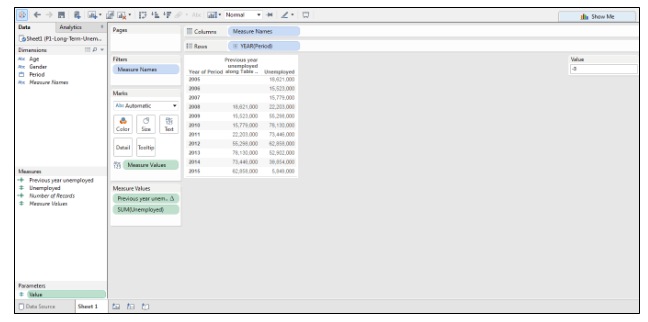
6. Drag and drop the newly created calculated field towards the table.
Thus Tableau has extracted the previous year’s unemployment numbers with the help of the lookup functionality. We can keep changing the offset value to fetch the numbers based on our needs. A value of 1 will look up the immediate next year’s value and display on the table.
Example #2
Parameter Control for Offset
You can also dynamically change the offset value by introducing the concept of the parameter. The parameter will give the liberty to change the offset value in the visualization itself, rather than editing the calculation field each time to change the number. We need to do a few changes in our workspace such as adding a new parameter and using that parameter in our lookup function.
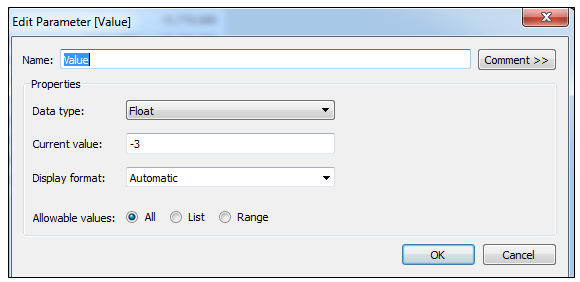
1. Right-click on the measures pane and select the ‘create parameter’ option. Specify the name and current value. The current value will be the same which you want the offset value to be.
2. Now modify the calculated field by replacing the parameter name with the offset value.
3. The workspace will thus look something like this. This feature will be very useful while creating dashboards and stories.
Example #3
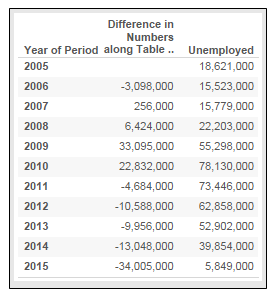
To Calculate the Difference in the Unemployment Numbers Compared to the Previous Year using Lookup
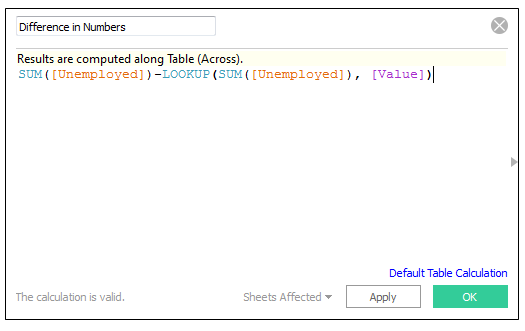
Create a new calculated field in which we will make the difference between the current value and the value specified based on the offset
Drag and drop this new calculated field over the table.
Use cases for Lookup Function
- Lookup function does the calculation and provides the quarterly sales for each year in a table calculation.
- Consider an example of a sales data of an organization whose sales tend to change seasonally. There may be more sales during Christmas week rather than any normal weekend. Thus to compare sales at the same time periods in consecutive years we use the lookup function in tableau. Lookup functions are used to extract values that are offset from a target column.
- To compare quarterly sales for over a period of time.
- Annual subtotal for various years.
Conclusion
Below are the major highlights of the Lookup function –
- The most widely used Table calculation and is used to lookup value within the table based on the offset position.
- Every time changing the offset value in the calculated field is tedious work, thus Tableau handles it through Parameter. The offset value can be replaced by a parameter and giving the parameter control in the view itself. This will make the visualization more interactive.
- If the offset value specified is more than the number of rows in the table it would return empty results.
Recommended Articles
This is a guide to LOOKUP Function in Tableau. Here we discuss what is LOOKUP Function in Tableau, the difference between Excel Lookup and Tableau Lookup with appropriate examples. You can also go through our other suggested articles to learn more –
