Introduction to Low Pass Filter in Matlab
MATLAB is a programming environment that is interactive and is used in scientific computing. It is extensively used in a lot of technical fields where problem solving, data analysis, algorithm development, and experimentation is required. The software which is discipline specific is extensively written using MATLAB. In this article, we will study how to create a low pass filter in MATLAB. MATLAB provides us with ‘dp.LowpassFilter’ command for the purpose of using low pass filter.
Before we start learning how low pass filtering works in MATLAB, let us refresh our understanding of what low pass filter is and why we need it. We use low-pass filters to cut off high frequency signals. As the name suggests these filters provide easy passage to signals with a frequency lower than a threshold value but don’t allow frequencies higher than this cut-off. Low pass filters are mainly of 2 types:
- Inductive low-pass filters
- Capacitive low-pass filters
Syntax of Low Pass Filter Matlab
Let us now understand the syntax of low pass filters in MATLAB:
Syntax:
LowPass = dsp.LowpassFilter
Description:
LowPass = dsp.LowpassFilter will return a low pass filter of minimum order and default filter properties. If dsp.LowpassFilter is called with default properties, the following are some default values by which the input signal will be filtered by the low pass filter:
- passband frequency will be 8 kHz
- stopband frequency will be 12 kHz
- passband ripple will be 0.1 dB
- stopband attenuation will be 80 dB.
Before we proceed, we need to understand 2 very important concepts related to low-pass filters:
- IIR
- FIR
IIR (Infinite impulse response): These filters provide an infinite impulse response. In simple words, the impulse response of IIR never becomes equal to zero, but only approaches it.
FIR (Finite impulse response): These filters have finite impulse response. In simple words, the response of impulse using FIR stays only for finite samples. The impulse response will never by greater or less than the set samples.
How Low Pass Filter is Implemented in Matlab?
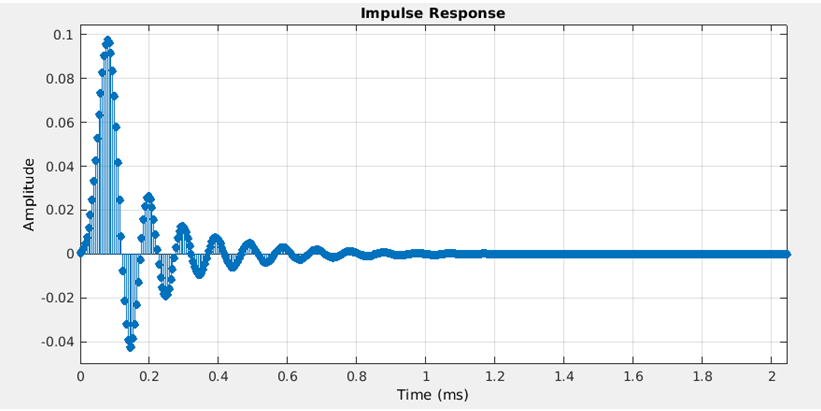
Let us now understand how low pass filter is implemented in MATLAB. Let us first create an impulse response and use filter type as IIR filter and keep the main filter as low pass filter
Example #1
Syntax:
SR = 20.2e4
[Defining the Sample Rate]
FType = ‘IIR’;
[Defining the Filter Type as IIR]
Fp = 10e3;
[Defining the Pass band frequency]
Fs = 20e3;
[Defining the Stop band frequency]
PBRipple = 0.2;
[Defining the Pass band ripple]
SBAtten = 70;
[Defining the Stop band Attenuation]
LPFiir = dsp.LowpassFilter(‘SampleRate’, SR, …
‘FilterType’, FType, …
‘PassbandFrequency’,Fp, …
‘StopbandFrequency’,Fs, …
‘PassbandRipple’, PBRipple, …
‘StopbandAttenuation’, SBAtten);
fvtool(LPFiir,’Analysis’,’impulse’)
[Using filter visualization tool to draw the output impulse]Code:
SR = 20.2e4

FType = 'IIR';

Fp = 10e3;

Fs = 20e3;

PBRipple = 0.2;

SBAtten = 70;

LPFiir = dsp.LowpassFilter('SampleRate', SR, ...

'FilterType', FType, ...

'PassbandFrequency',Fp, ...

'StopbandFrequency',Fs, ...

'PassbandRipple', PBRipple, ...

'StopbandAttenuation', SBAtten);

fvtool(LPFiir,'Analysis','impulse')
Output:
As we can see in the output, we have infinite impulse response which only approaches to zero but never actually becomes zero.
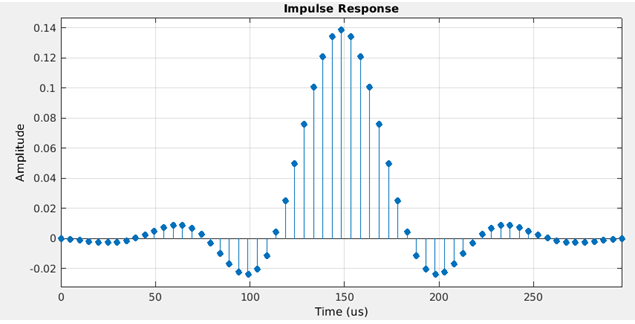
Next, we will learn how the code for low pass filter with filter type FIR (Fixed impulse response) looks like in MATLAB.
Example #2
Syntax:
SR = 20.2e4
[Defining the Sample Rate]
FType = ‘FIR’;
[Defining the Filter Type as FIR]
Fp = 10e3;
[Defining the Pass band frequency]
Fs = 20e3;
[Defining the Stop band frequency]
PBRipple = 0.2;
[Defining the Pass band ripple]
SBAtten = 70;
[Defining the Stop band Attenuation]
LPFfir = dsp.LowpassFilter(‘SampleRate’, SR, …
‘FilterType’, FType, …
‘PassbandFrequency’,Fp, …
‘StopbandFrequency’,Fs, …
‘PassbandRipple’, PBRipple, …
‘StopbandAttenuation’, SBAtten);
fvtool(LPFfir, ‘Analysis’,’impulse’)
[Using filter visualization tool to draw the output impulse]Code:
SR = 20.2e4

FType = 'FIR';

Fp = 10e3;

Fs = 20e3;

PBRipple = 0.2;

SBAtten = 70;

LPFfir = dsp.LowpassFilter('SampleRate', SR, ...

'FilterType', FType, ...

'PassbandFrequency',Fp, ...

'StopbandFrequency',Fs, ...

'PassbandRipple', PBRipple, ...

'StopbandAttenuation', SBAtten);

fvtool(LPFfir, 'Analysis','impulse')
Output:
As we can see in the output, there are only a finite set of responses as expected by us.
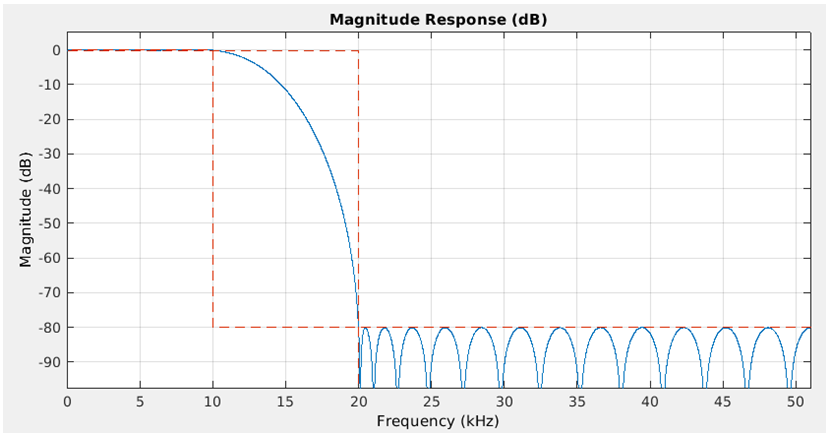
In some cases, while using low pass filters, we might need magnitude responses related to the FIR and IIR filter types. Let us learn how to get these magnitude responses in MATLAB.
Example #3
Syntax:
The code for creating magnitude response is like what we have already learned, with small changes. Let us create a different impulse response for visualizing the magnitude response:
SR = 10.2e4
[Defining the Sample Rate]
FType = ‘FIR’;
[Defining the Filter Type as FIR]
Fp = 10e3;
[Defining the Pass band frequency]
Fs = 20e3;
[Defining the Stop band frequency]
PBRipple = 0.2;
[Defining the Pass band ripple]
SBAtten = 80;
[Defining the Stop band Attenuation]
LPFfir = dsp.LowpassFilter (‘SampleRate’, SR, …
‘FilterType’,FType, …
‘PassbandFrequency’, Fp, …
‘StopbandFrequency’, Fs, …
‘PassbandRipple’, PBRipple, …
‘StopbandAttenuation’, SBAtten);
fvtool(LPFfir)
[Using filter visualization tool to draw the output impulse. Note that, we have only passed the LPFfir as an argument to get the magnitude]Code:
SR = 10.2e4

FType = 'FIR';

Fp = 10e3;

Fs = 20e3;

PBRipple = 0.2;

SBAtten = 80;

LPFfir = dsp.LowpassFilter ('SampleRate', SR, ...

'FilterType',FType, ...

'PassbandFrequency', Fp, ...

'StopbandFrequency', Fs, ...

'PassbandRipple', PBRipple, ...

'StopbandAttenuation', SBAtten);

fvtool(LPFfir)
Output:
Recommended Articles
This is a guide to Low Pass Filter Matlab. Here we also discuss the introduction and syntax of low pass filter Matlab along with how low pass filter is implemented in Matlab. You may also have a look at the following articles to learn more –


