Updated March 31, 2023

Introduction to nhibernate profiler
NHibernate profiler is the debugger that visually illustrates everything and is used for real-time scenarios where the developers can achieve the perspective and details of insight while using NHibernate. In this article, we will have a detailed discussion about what the NHibernate profiler is, how to use this tool, and the installation of the NHibernate profiler and required packages.
What is nhibernate profiler?
NHibernate profiler is the tool that displays everything related to NHibernate in your application visually and also provides alerts wherever necessary. The architecture of this tool is designed and contributed by many of the efficient and top leaders of various renowned industries. The code review method is very comprehensive and concise as all the notifications and alerts are displayed and help recognize the patterns and any sort of issues related to applications, such as its misuse. In order to guide us to the correct path for our efforts, the profiler comes up with the links for finding out the problematic code and also display any related alerts.
Using NHibernate Profiler
We can make use of the NHibernate profiler in various ways. Firstly, let us understand the shortcuts that we can use to focus and move certain objects in the NHibernate profiler. Capital S is used to focus on the tab header of the session. If you want to focus on the tab header of Statements, then make use of the capital T key on the keyboard. For having the focus over the tab header of the Details section, you can click on the capital D key on the keyboard and in the case of the tab header of Statistics, make the use of the capital F key to focus on it. Taking about the movement to previous and next tabs, you can make the use of left and right keys on the keyboard, respectively. In case of moving to next or previous statements or sessions, click on the up and down arrow keys on the keyboard. These shortcut keys are supported by NHibernate profiler along with other standard operating system shortcuts.
You can also get the statistics of the of the NHibernate; then you will have to change the configurations of NHibernate and set the value of the property generate_statistics to true by using the standard configuration mechanism for NHibernate –
<property name = "generate_statistics" > true </property>Other than this, there are many other ways in which you can work with the profiler by not changing any of the code of the application.
nhibernate profiler install all the required
NHibernate is a commercially available tool and is very useful while working with NHibernate applications. In order to install it, you will have to make use of the Nuget Package manager. The steps required for the same are as specified here –
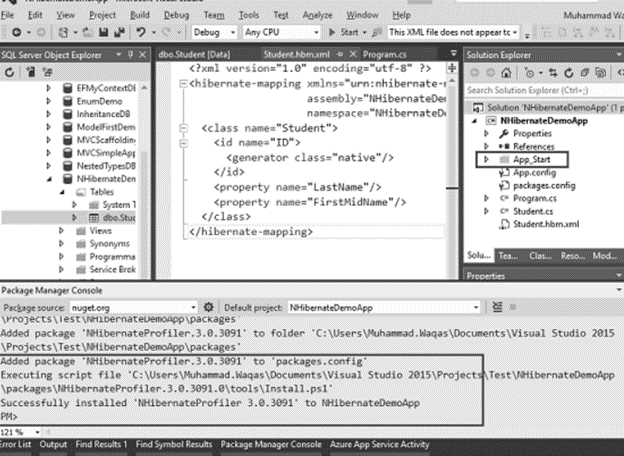
Open the console of Nuget manager and then click on the tools menu. Click on Nuget Package manager and then the package manager console. A new window with the console will open up, which will look as shown below –
We will enter the below command for installing NHibernate –
Install -package NHibernateProfilerThe output of executing the above command is as shown below –
Here, we can observe that a message for successful execution has been completed. Internally, it installs all the packages in a binary format that the NHibernate profiler will require. At the same time, the launching of NHibernate will be made. Although this is just for demo purposes, you can still use it for the upcoming 30 days as it is for free of cost version of the profiler. After following all the above steps, the profiler will be completely optimized for working along with the web applications.
A folder named App_start will automatically be added in the tool’s solution explorer. A few statements will be added at the beginning of the program file called main. You can delete the App_start folder and also these statements to make your task a little easy and simple. The statements will be for prestart() function calling by using the classes of App_Start and NHibernateProfilerBootstrapper. Instead of this, you can simply add the call to the initialize method by writing NHibernateProfiler.Initialize. You can refer to the below code for the same –
using HibernatingRhinos.Profiler.Appender.NHibernate;
using NHibernate.Cfg;
using NHibernate.Dialect;
using NHibernate.Driver;
using System;
using System.Linq;
using System.Reflection;
namespace EducbaSampleProfilerDemo {
class Program {
static void Main(string[] args) {
NHibernateProfiler.Initialize();
var sampleConfig = new Configuration();
String Data srcpath = asia13797\\sqlexpress;
String Initial educbaCatalog = NHibernateDemoDB;
String securityForIntegration = True;
String valueForTimeoutOfConn = 15;
String crypting = False;
String certificateOfServerTrust = False;
String ApplicationIntent = ReadWrite;
String FailureOfMultiSubnet = False;
sampleConfig.DataBaseIntegration(sampleReference = > { sampleReference.ConnectionString = "Data srcpath +
Initial educbaCatalog + securityForIntegration + valueForTimeoutOfConn + crypting +
certificateOfServerTrust + ApplicationIntent + FailureOfMultiSubnet";
sampleReference.Driver<SqlClientDriver>();
sampleReference.Dialect<MsSql2008Dialect>();
sampleReference.LogSqlInConsole = true;
});
sampleConfig.AddAssembly(Assembly.GetExecutingAssembly());
var sampleSefact = sampleConfig.BuildSessionFactory();
using (var session = sampleSefact.OpenSession()) {
using (var profilerTransaction = session.BeginTransaction()){
var writers = session.CreateCriteria<Student>().List<Student>();
Console.WriteLine("\nFetching of the list of complete data again\n");
foreach (var writer in writers) {
Console.WriteLine("{0} \t{1} \t{2}", writer.ID, writer.FirstMidName,
writer.LastName);
}
profilerTransaction.Commit();
}
Console.ReadLine();
}
}
}
}
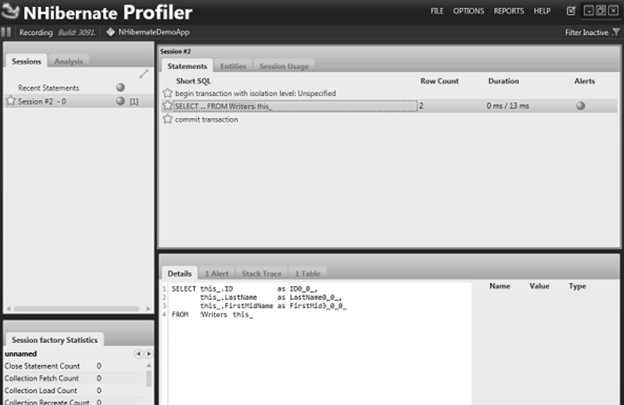
After the above application is run, the data will be sent all over the application of NHibernate Profiler, because of which we will be getting a very nice view and format of the status of the transaction, which shows that it has started and exactly what SQL will be doing inside the DB.
Because of this NHibernate profiler tool, we can get detailed insights related to your application, and it proves very beneficial to understand how the application will be working internally. When the application complexity levels increase, this feature of the profiler proves to be a boon. Sometimes, you feel the necessity of using something like SQL profiler along with what knowledge you have of NHibernate.
Conclusion
We can make use of the NHibernate profiler to get the visual representation of all the executions happening inside the NHibernate application. In order to get detailed insights into how your application is performing, you can easily install and use the NHibernate profiler by using the Nuget package manager.
Recommended Articles
This is a guide to nhibernate profiler. Here we discuss what the NHibernate profiler is, how to use this tool, and the installation of the NHibernate profiler and required packages. You may also have a look at the following articles to learn more –


