Updated July 15, 2023
What is a Normal Yield Curve?
The term “yield curve” refers to the graphical representation of the relationship between the bond yields and the corresponding maturities.
It is when the short-term debt instruments provide a lower yield than the long-term debt instruments with similar credit quality, primarily because of the investment horizon. It is also popularly known as the positive yield curve because it exhibits an upward slope.
Explanation of Normal Yield Curve
The normal yield curves are one of the three yield curves. The two other types are steep and inverted yield curves. It indicates that the investors need a higher return to compensate for the perceived risks associated with blocking the money for a longer period of time. The normal yield curves gives the interest rates an upward slope, wherein the curve rises as we move from the left (shortest maturity period) to the right (longest maturity period). It is a very important market indicator, and thus it is published by many financial institutions, including the Federal Reserve.
Graphical Representation of Normal Yield Curve
The graph of a yield curve plots the yield of bonds of similar credit quality against their corresponding maturities, ranging from the shortest to the longest. Only bonds with similar risk profiles are charted on the same yield curve.
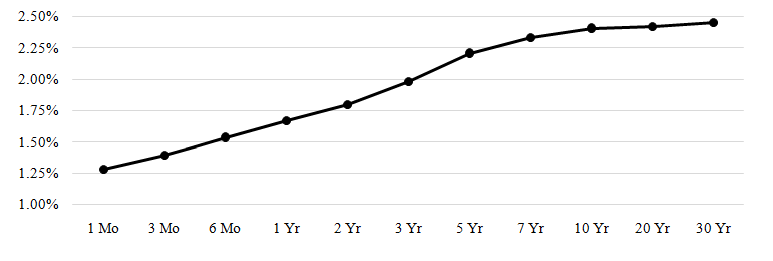
It shown below is a normal curve that exhibits an upward slope as it moves from a maturity period of 1 month to 30 years, during which the yield increased steeply until 7 years, and after that, it plateaued. This indicates that long-term investors charge a premium for the long locking period. However, the graph also indicates that the incremental risk premium decreases with the increase in the maturity period, and the curve flattens out after a certain point.
Normal Yield Curve and Other Indicators
Many economic indicators are available in the market, such as stock prices, interest rates, etc. However, It is one of the most reliable leading indicators as the ex-post accuracy of its projection results has demonstrated better predictive power than the other indicators. For instance, various experts consider the normal yield curves to be an efficient tool for predicting the occurrence of a recession, and their statement is based on solid statistical studies.
Normal Yield Curve Interest Rates
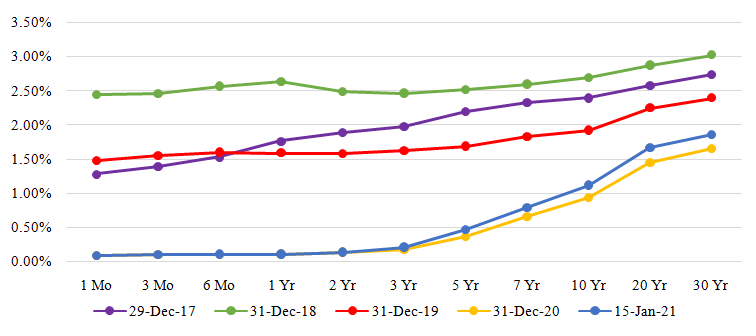
The chart and the table below capture the yield curves interest rates as available from the US Department of the Treasury. It corresponds to five different dates from five different years. It can be seen that 29-Dec-17, 31-Dev-18, and 31-Dec-19 are normal in nature. However, 31-Dec-20 and 15-Jan-21 are slightly steep because of the revival the economy is witnessing after the economic setbacks experienced during the pandemic.
Source: US Department of the Treasury
| Date | 29-Dec-17 | 31-Dec-18 | 31-Dec-19 | 31-Dec-20 | 15-Jan-21 |
| 1 Mo | 1.28% | 2.44% | 1.48% | 0.08% | 0.08% |
| 3 Mo | 1.39% | 2.45% | 1.55% | 0.09% | 0.09% |
| 6 Mo | 1.53% | 2.56% | 1.60% | 0.09% | 0.10% |
| 1 Yr | 1.76% | 2.63% | 1.59% | 0.10% | 0.10% |
| 2 Yr | 1.89% | 2.48% | 1.58% | 0.13% | 0.13% |
| 3 Yr | 1.98% | 2.46% | 1.62% | 0.17% | 0.20% |
| 5 Yr | 2.20% | 2.51% | 1.69% | 0.36% | 0.46% |
| 7 Yr | 2.33% | 2.59% | 1.83% | 0.65% | 0.78% |
| 10 Yr | 2.40% | 2.69% | 1.92% | 0.93% | 1.11% |
| 20 Yr | 2.58% | 2.87% | 2.25% | 1.45% | 1.66% |
| 30 Yr | 2.74% | 3.02% | 2.39% | 1.65% | 1.85% |
Importance of Normal Yield Curve
It is very important because it indicates the movement in the interest rates, which in turn indicates whether the economy is expanding or contracting. Further, its shape also affects an individual’s portfolio return, making some bonds more valuable than others. Also, statistical evidence shows that it can be used as the leading indicator of a recession. However, some experts believe the correlations between the yield curves and recessions might not hold well as we enter a world of extraordinary monetary experiments.
Advantages
- The slope of a normal yield curve gives a fair idea about the expectations of the bond market investors based on the current economic activities and inflation.
- It is indicative of a stable economic condition.
- The interpretation of the yield curves slope can be useful for making top-down investment decisions.
Disadvantages
- Some of the market theories state that there is no relationship between long-term, medium-term, and short-term interest rates. The interest rates of each bucket merely indicate the demand and supply matrix of that bond market segment.
- At times, it can be difficult to differentiate between a normal and a steep yield curve, as both curves share a similar slope for a large period of time. This can impact the estimation of the future economic condition.
Conclusion
Thus, the normal yield curve is the most commonly observed as it indicates the sentiments of bond investors during normal economic conditions. However, the slope and the direction of a yield curve show the current state and the possible direction of the economic condition. The other major types are steep and the inverted yield curve.
Recommended Articles
This is a guide to Normal Yield Curve. Here we also discuss it’s meaning and graphical representation and its advantages and disadvantages. You may also have a look at the following articles to learn more –


