Introduction to NumPy Histogram
The famous programming language python has a core library which is specifically designed for scientific computation that provides for tools to integrate languages like C and C ++ which is known as NumPy (meaning numerical python). It is specifically useful for coders who deal with data science and big data analysis with parallel mathematical operations being conducted which are provided by calling the predefined numpy functions or tools. Among one of the features present in this library is the histogram function known as NumPy Histogram().
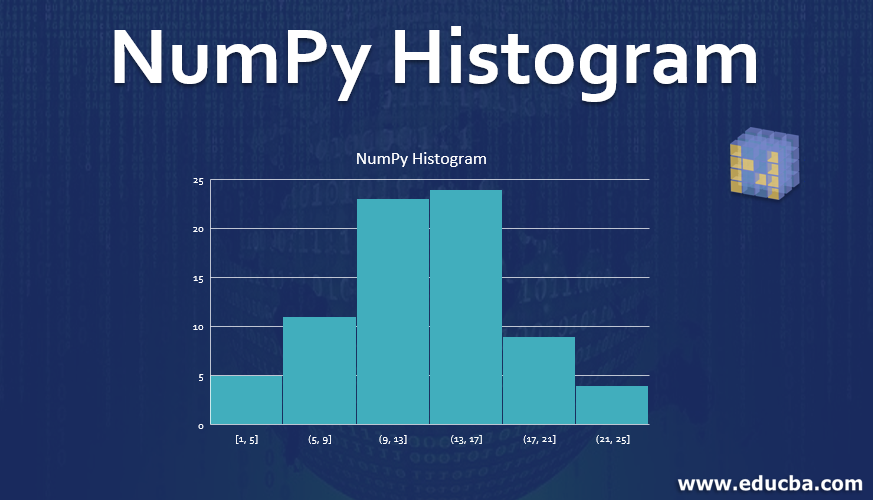
The numpy histogram function provides for the data scientist to perform graphical analysis on the basis of the data and their respective frequency distribution. The Numpy histogram function has two parameters called bins and input arrays. The bins are rectangular-shaped blocks that are distanced at equal horizontal width that correspond to the respective class interval. The difference in the height of these beans is representative of the difference in the frequency of these class intervals.
Syntax
Following is the representation in which code has to be drafted in the Python language for the application of the numpy histogram function:
import numpy as np
//The core library of numpy is being imported so that the histogram function can be applied which is a part of the numpy library
numpy.histogram (a, bins=10, range = None, normed = None, weights = None, density = None)
The various criteria is set to define the histogram data are represented by bins, range, density, and weights.
Another function called the plt() from the matplot library is used in converting the numeric data into histogram graphs. The function uses the data from the array as parameters converting it to a histogram.
Parameters
Here are the following Parameters of NumPy Histogram mention below
1. a: array_like (Represent the set of values that has been input by the user)
These values would be arranged in the set of arrays which would be flattened and computed to who returned the histogram.
2. bins: can be either int or sequence (of values which are either string or scalar)
If the bins are int (which define the total number of bins with equal width that have been mentioned in the range which is taken to be 10 as a default value)
If the pins are sequence then that represents the monotonic increase in the array which effects on the bin’s width edges (this is inclusive of the rightmost age which gives rise to two non-uniform bin width)
The histogram’s bin edges define the method of calculation which has to be used depending upon the optimal width of the bin. This is specifically true if the bin has string values.
3. range : (float [upper value] , float [lower value]) (optional)
Operations and the lower range of the bin are represented through the float values. If the limit has not been provided and automatic range is taken by the system which is represented by the syntax a.min(), a.max(). The range helps in ignoring or by-passing any values which lie outside of the range are not considered during the computation, which has a great impact on the automated bin computation. It must be noted that the value of the first element which has been mentioned in the range must be less than or at least equal to the second element.
4. normed: bool (optional for code syntax) [It has been deprecated since the release of version 1.6.0 of Python]
The density argument used in Python can be taken to be its equivalent in terms of functionality, but its application produces discrepancies in the result when there is and an equal distribution with regard to the width of the bins.
5. weights : array_like (optional for code syntax)
An array of weights, of the same shape as a. Each value in an only contributes its associated weight towards the bin count (instead of 1). If the density is True, the weights are normalized, so that the integral of the density over the range remains 1.
6. density : bool (optional for code syntax)
The bin count accounts for the contribution of each value in accordance with its associated weight. The density value true normalization of the weights occurs making the integral of the density remain over 1. If the value is false, there are a number of samples that are contained in each of the resultant bins.
Examples to implement histogram in NumPy
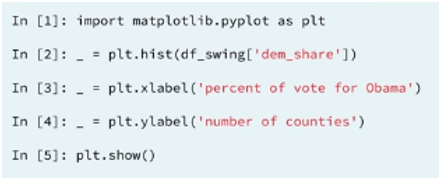
Let us consider the example of the number of votes that went in the favour of Obama in the elections across different countries. So, the matplot library module has to be utilized whether his function would be called to generate the histogram.
- A dummy variable called underscore is assigned to the histogram. After the creation of the histogram, the axis has to be labelled. The axis of the bar of the histogram can be specifically changed by the user.
- Adding to it, the number of bins can also be specified by the user (say 20) by simply using the bins keyword and matplotlib will automatically generate 20 evenly spaced bins.
- Generally, the seaborn styling setting is preferred to be used which is a visualisation package that was written primarily by Michael Waskom. It can also be used as default by using the SNS set function using the below-mentioned code.
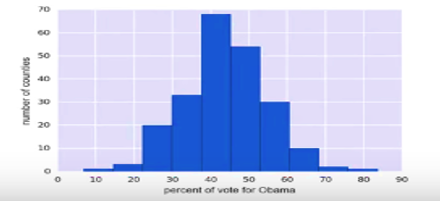
The following histogram is generated as an output by performing the above-mentioned coding procedure which represents the number of votes which were in the favour of Obama by various countries.
Conclusion
The number histogram function provides for a pre-developed graphical representation functionality which is quintessential and very handy acting as a preparatory step the four functions such as edge detection or thresholding are performed. It serves as a very efficient tool when dealing with data that need visualization and creating a visual difference using image formats that are compressed and uncompressed. It specifically is advantages for project detection of color changes between various histogram plots serve as a tool to perform analysis.
Recommended Articles
This is a guide to NumPy Histogram. Here we discuss the Examples to implement histogram in NumPy along with the parameters. You may also have a look at the following articles to learn more –


