Updated April 1, 2023

Introduction to NumPy Linear Regression
Linear regression is one of the efficient and simplest algorithms in machine learning. It shows the relationship between two variables. In this, one variable is dependent, and another variable is independent. Using these two variables is represented by equation Y=aX+b, where y is the output variable dependent on x, and x is the independent input variable. Numpy is a python library used for numerical operations such as matrices, algebra, and transforms. Numpy is a short form for numerical python. Numpy makes the implementation of linear regression easy and produces the best for solution. In this topic, we are going to learn about NumPy linear regression.
Syntax
import numpy as np
np.(operation)
In the above syntax first syntax is to import the numpy library, and the second syntax is used for inbuilt mathematical operations such as shape, reshape, max, min, mean, std, pow, etc.
from sklearn. linear_model import Linear Regression
Obj1 = LinearRegression ()
In this syntax, the first line is used to import a Linear regression model in python, and the second syntax is used to create a model variable. A model variable is an object which is required to use other functions like the fit, predict, and score.
How does linear regression work in NumPy?
Linear regression basically works on fitting function Y= aX + b. In this equation, ‘Y’ is the n variable and output of the function, and ‘X’the is an independent input variable. Thus, the coefficient is presented by ‘a’, and the intercept is represented by ‘b’; both are used to trace the curve.
To implement a linear regression model, the very first step is to import libraries whatever requires, such as Numpy, pandas, matplotlib, etc. These libraries help in preprocessing and modification of databases. Then the next step is to import the linear regression model. After importing the model, we can fit our input variables into the model, and by using the predict function, we can predict the values of Y, which is the output variable.
Example of NumPy linear regression
Let us consider one example of salary prediction. x is the input independent variable, and y is the dependent salary prediction variable on x. In the database, two columns are present the first column is Years of experience, and the second column is Salary. Total thirty entries or we can say the combination is present; therefore, the shape of the database is thirty rows and two columns (30,2). In this example, our task is to find out the linear regression curve and predict the salary of new entries and output variables…To trace any curve, we should know the coordinates of the theta curve, so we will trace the curve by finding the coefficient and intercept. First, we need to import libraries in pythons like pandas and numpy; here, we import numpy as np and pandas as pd. We can use any variable for libraries instead of np and pd. Then we need to import data from the database; here, the input file is a csv file (comma separate file ).
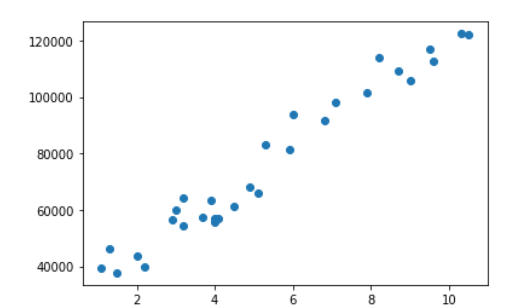
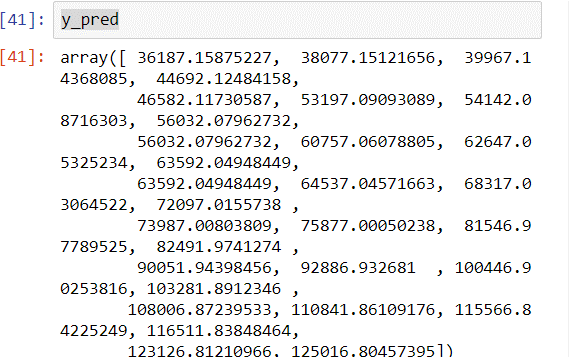
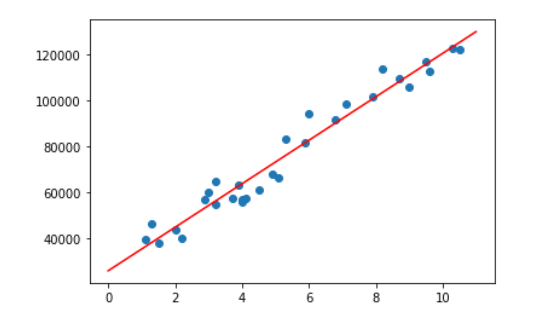
Then we will check the information on the database how many rows and columns are present in the database by using the shape function, and other information will be visible by using the info function. Once we reshape the database, we can import the linear regression model. The linear regression model is available in sklearn. In the next step, we need to fit the database by fit function, but in this example, there is a problem with the shape of the database; that’s why we will reshape the database by using numpy. Then we will be able to fit the input x variable into the linear regression model. once we fit the model, we can check coefficients and intercepts of a line. Then there is one more function which is predicted. We can predict y values by this function; this is our expected output. We are using one more library that is matplotlib, to see a curve graphically. In the first figure, there are input values of the database, and in the third figure, we can see the linear regression curve. The second figure shows the output of y predicted values.
Python code for linear regression using Numpy:
import numpy as np
import pandas as pd
df = pd.read_csv('Salary.csv')
df.shape
df.info ( )
import matplotlib.pyplot as plt
plt.scatter ( df  [ 'YearsExperience' ] , df  [ 'Salary' ] )
from sklearn.linear_model
import LinearRegression
Obj1 = LinearRegression ( )
X = df [ 'YearsExperience' ]
y = df [ 'Salary' ]
X_np = X.values
X_np.reshape (-1 ,1) . shape
X1 = X_np. Reshape (30 ,1)
Obj1.fit( X1,y)
Obj1.intercept_
Obj1.coef_
plt.scatter ( df ['YearsExperience' ] ,df [ 'Salary' ])
plt.plot ( [ 0 ,11] , [Obj1.predict ( [  [ 0 ] ]) ,Obj1.predict ( [ [ 11] ] ) ] ,c = 'red')
model = LinearRegression ( )
y_pred
model.fit ( d f [ ['YearsExperience'] ] ,df [ 'Salary' ])
y_pred = model.predict ( df [ ['YearsExperience'] ])
Figure 1: Input Data
Figure 2: Output Y predicted values
Figure 3: Regression curve
Conclusion
In this article, we have seen how to import databases and reshape the database by using numpy. Then we create a linear regression model, fit the model, and predicted values for the output variable. From the Numpy library, we have used various functions like shape, reshape, and values. This function supports a model in the preprocessing of the database. We can also check the score or accuracy of the linear regression model by using the ‘score’ function.
Recommended Articles
This is a guide to NumPy linear regression. Here we discuss How linear regression work in NumPy and Example with the code. You may also have a look at the following articles to learn more –


