Updated May 18, 2023
Definition of NumPy Meshgrid
In Python, meshgrid is a function that creates a rectangular grid out of 2 given 1-dimensional arrays that denote the Matrix or Cartesian indexing. MATLAB inspires it. This meshgrid function is provided by the module numpy. Coordinate matrices are returned from the coordinate vectors. In this, we will discuss more about meshgrid function in detail.
Syntax
Below is the syntax of meshgrid function in numpy.
numpy.meshgrid(*xi, **kwargs)Four parameters of this function are:
1. x1, x2,…, xn
- Required parameter
- The parameter denotes the coordinates of the grids in the 1-D arrays.
2. indexing
- Optional parameter
- The parameter denotes the cartesian(‘xy’, default) or matrix indexing of the result.
3. Sparse
- Optional parameter
- Takes Boolean value
- A sparse grid is returned for conserving memory if ‘True’ is passed.
- Default value: False
4. Copy
- Optional parameter
- Takes Boolean value.
- The original array’s view is returned for conserving memory if ‘false is passed.
- Default value: False
If the parameters sparse and copy are set to False, non-contiguous arrays will be returned. Moreover, 1 or more elements of a broadcast array can point to a single memory location. Copies of the arrays have to be made first if writing has to be done into the arrays. The return value is Length of the coordinate from the coordinate vectors.
How does Meshgrid Function Work in NumPy?
In order to understand the working of meshgrid function in numpy, let us see an example.
Steps for creating meshgrid:
- Import the module numpy.
importnumpy as np- Create two variables.
n1, n2 = (5, 3)- Create two arrays
a = np.linspace(0, 1, n1)
b = np.linspace(0, 1, n2)- Call the meshgrid function with the arrays as parameters.
aa, bb = np.meshgrid(a, b)- Display the result
print(aa)
print(bb)
Examples of NumPy Meshgrid
Let us see some sample programs of meshgrid function.
Example #1
Python program to print the meshgrid coordinates of two arrays.
Code:
import numpy as np
n1, n2 = (5, 3)
a = np.linspace(0, 1, n1)
b = np.linspace(0, 1, n2)
aa, bb = np.meshgrid(a, b)
print(aa)
print(bb)
Output:
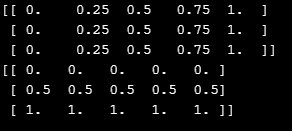
To execute this program, it is necessary to import the numpy module using the alias “np”. The code begins by creating two variables, “n1” and “n2”, and assigning them the values 5 and 3, respectively. The program imports the “numpy” module with the alias “np” and uses the linspace() function to create two arrays, “a” and “b”. The meshgrid() function is then called with the arrays “a” and “b” as arguments, and the resulting output is stored in the variables “aa” and “bb”. The values of “aa” and “bb” are printed. Two arrays containing the lengths and vectors of coordinates will be shown after the code is executed. Plotting functions within the given coordinate range is possible using these coordinate values.
Example #2
Python program to print the meshgrid coordinates of two arrays that are between specified values.
Code:
import numpy as np
l = np.linspace(-7, -1, 9)
k = np.linspace(-6, -2, 11)
x1, y1 = np.meshgrid(l, k)
print("x1 is : ")
print(x1)
print("y1 is : ")
print(y1)
Output:
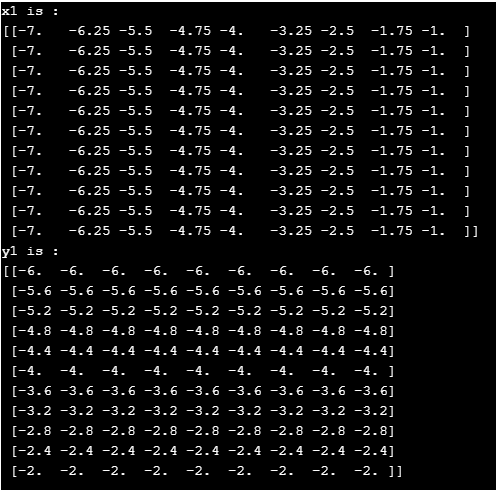
In this program, also,numpy modules have to be imported with any alias name. The alias name in this program is np. The program starts by creating two arrays, “l” and “k”, using the “linspace()” function. Then, two variables, “x1” and “y1”, are assigned the return value of the “meshgrid()” function, which takes the arrays “l” and “k” as inputs. The program then prints the values of “x1” and “y1”. When executed, the program displays two arrays containing coordinate lengths and coordinate vectors.
Example #3
Python program to print the meshgrid coordinates of two arrays where sparse is true.
Code:
import numpy as np
n1, n2 = (5, 3)
l = np.linspace(0, 1, n1)
k = np.linspace(0, 1, n2)
aa, bb = np.meshgrid(l, k, sparse=True)
print(aa)
print(bb)
Output:
To execute this program, you need to import the “numpy” module using the alias “np”. Create two variables named “n1” and “n2” with the values 5 and 3, respectively. Generate two arrays, “l” and “k”, using the “linspace()” function. Assign the return value of “meshgrid()” to the variables “x1” and “y1”. The “sparse” variable is set to True in order to conserve memory. Pass the “sparse” value along with the arrays “l” and “k” to the function. Finally, print the values of “x1” and “y1”. The format of these arrays may differ from the previous programs.
Example #4
Python program to print the meshgrid coordinates of two arrays and display contour lines.
Code:
import numpy as np
import matplotlib.pyplot as plt
n = np.arange( -5, 5, 0.1 )
m = np.arange( -5, 5, 0.1 )
x, y = np.meshgrid( n, m, sparse=True )
c = np.sin( x**2+ y**2  ) / ( x**2 + y**2 )
z = plt.contourf( n, m, c )
plt.show()
Output:
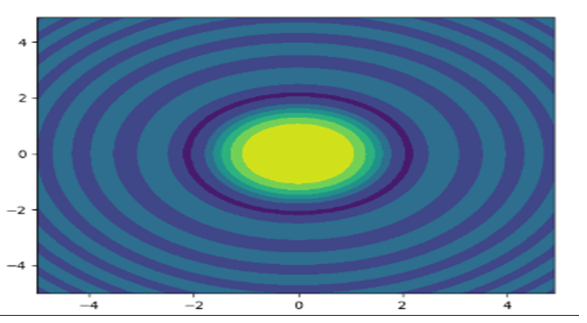
To run the program, import the “numpy” module with the alias “np”. Create two arrays, “n” and “m”, using the “arange()” function. Assign the return value of the “meshgrid()” function to the variables “x” and “y”. Set the variable “sparse” to True. Pass the arrays “n” and “m” along with the “sparse” value to the function. Declare a variable “z” and assign the return value of the “np.sin()” function to it. Finally, use the “plt.contourf()” function to plot the contour lines and filled contours.
Recommended Articles
We hope that this EDUCBA information on “NumPy Meshgrid” was beneficial to you. You can view EDUCBA’s recommended articles for more information.


