Updated April 15, 2023

Introduction to NumPy Normal Distribution
NumPy Normal Distribution is one of the various functions supported by the python numpy library that allows us to create a normal distribution or Gaussian distribution, which is can be used to fit the probability distribution of various elements and events that occur naturally or created by us. Furthermore, with the help of the feature random supported by the numpy library, we can create or generate a random normal distribution, and using various visualization packages in python, we can also plot and visualize the distribution.
Syntax:
The basic syntax of the NumPy Newaxis function is:
numpy.random.normal(loc=, scale= size=)- numpy.random.normal: It is the function that is used to generate the normal distribution of our desired shape and size.
- loc: Indicates the mean or average of the distribution; it can be a float or an integer.
- scale: A non-negative integer or float that indicates the standard deviation, which is the width of the overall distribution.
- size: It can be a tuple with a float or integer, and it represents the distribution’s output size or shape, and when loc and scales are n scalar values, the size will a single value is returned when size is given as none as input.
Examples of NumPy Normal Distribution
Given below are the examples of NumPy Normal Distribution:
Example #1
Let us see a basic example for understanding how the numpy normal distribution function is used to generate a normal distribution.
Code:
import numpy as np
mean = 2
sigma = 0.4
out = np.random.normal(mean, sigma, 500)
Output:
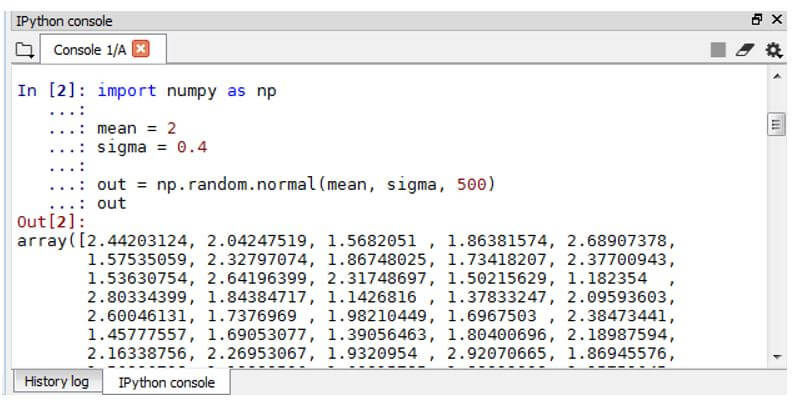
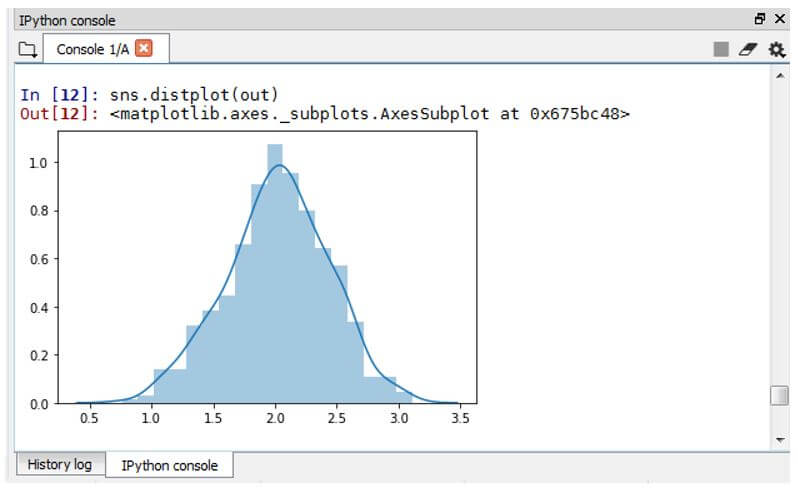
Here in the above example, we have called the numpy library for generating the normal distribution function. We have declared the mean and sigma or standard deviation of the normal distribution, and we have generated a distribution with the size of 500 where an array of 500 entries will be generated using the random.normal() function. This way, we can create a normal distribution. Also, we have used the seaborn package, which is used for the visualization of the plots. Using the distplot from a seaborn library, we have plotted our normal distribution. We can visualize the distribution along with the line curve for our distribution.
Example #2
In this example, we will see how to change the one-dimensional array to a two-dimensional array using the new axis object.
Code:
import numpy as np
out1 = np.random.normal(2, 4.5, size=(4, 8))
out1
Output:
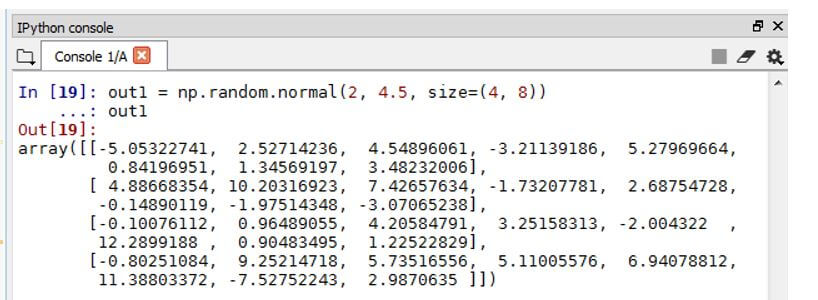
In this example, we have created a random normal distribution of our desired size where we have declared the size as an array of (4,8). The mean value is declared as 2, and the standard deviation is 4.5 and using the np.random.normal function, we have created the distribution.
Example #3
In this example, we have created two normal distribution arrays, ‘a’ and ‘b’, using different techniques.
Code:
import numpy as np
a = np.random.normal(size=(3, 4))
b = np.random.normal(loc=2, scale=3, size=(2, 3))
print(a)
print(b)
Output:
Here in the above example, we have called the numpy library for generating the normal distribution function. We have declared the mean and sigma or standard deviation of the normal distribution, and we have generated a distribution with the size of 500 where an array of 500 entries will be generated using the random.normal () function. This way, we can create a normal distribution. Also, we have used the seaborn package, which is used for the visualization of the plots. Using the distplot from a seaborn library, we have plotted our normal distribution. We can visualize the distribution along with the line curve for our distribution.
Example #4
In this example, we will see how we can visualize the normal distribution using both the matplotlib library and seaborn library.
Code:
import numpy as np
import seaborn as sns
import matplotlib.pyplot as plt
mean = 3
sigm = 5
out = np.random.normal(mean, sigma, 1000)
sns.distplot(out,hist=False)
plt.hist(out, 25, density=True)
Output:
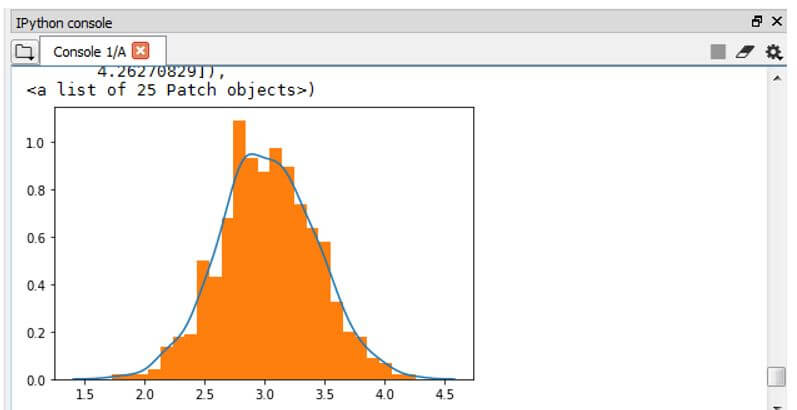
Similar to the 1st example, we have called the numpy library for generating the normal distribution function. We have declared the mean and sigma or standard deviation of the normal distribution, and we have generated a distribution with the size of 1000 where an array of 1000 entries will be generated using the random.normal () function. Also, we have used the seaborn and matplolib package, which is used for visualization of the plots. Using the distplot from a seaborn library, we have plotted only the curve of our normal distribution by giving the parameter hist as False. The histogram will not be displayed, and we generated the matplotlib library histogram of our distribution, and both plots are plotted as seen in the output.
Example #5
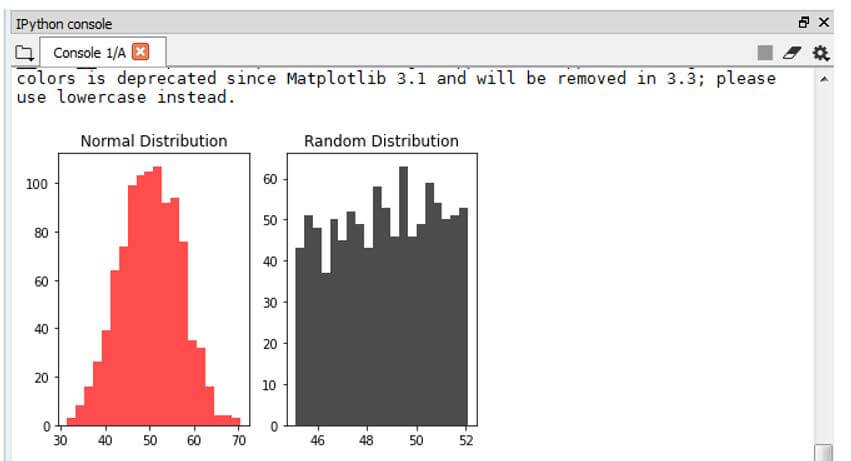
In this example, we have created normal distribution and a random distribution and compared both the distribution using histogram from the matplotlib library.
Code:
import numpy as np
N, mean, sigm = 1000, 50, 7
a = mean + sigm*np.random.randn(N)
b = mean + sigm*(np.random.rand(N)-0.7)
fig, axes = plt.subplots(ncols=2)
axes[0].set_title('Normal Distribution')
x, bin_1, patch1 = axes[0].hist(a, 20, facecolor='R', alpha=0.7)
axes[1].set_title('Random Distribution')
x2, bins_2, patch2 = axes[1].hist(b, 20, facecolor='K', alpha=0.7)
plt.show()
Output:
In this example, we generated two distributions, ‘a’ and ‘b’, which are normal and random distribution using the numpy random function. In addition, we have declared the number of array output ‘N’ as 1000, mean as 50 and standard deviation as 7, and we have generated both the arrays and plotted them in two axes using the matplotlib library and both the histogram clearly shows the difference in distributions.
Example #6
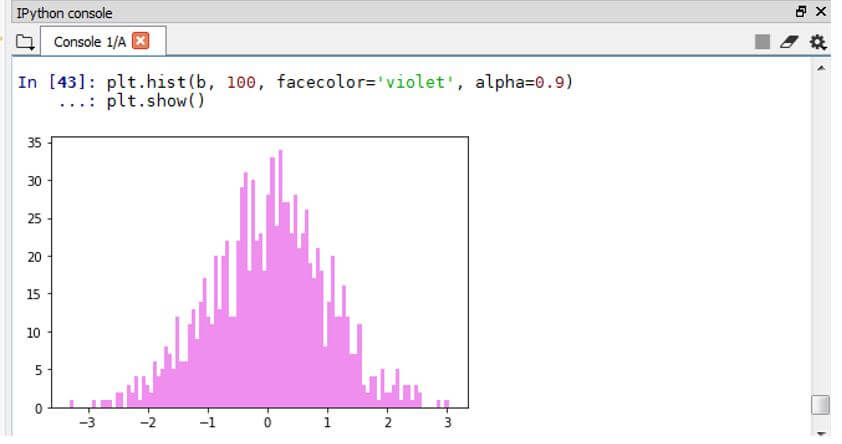
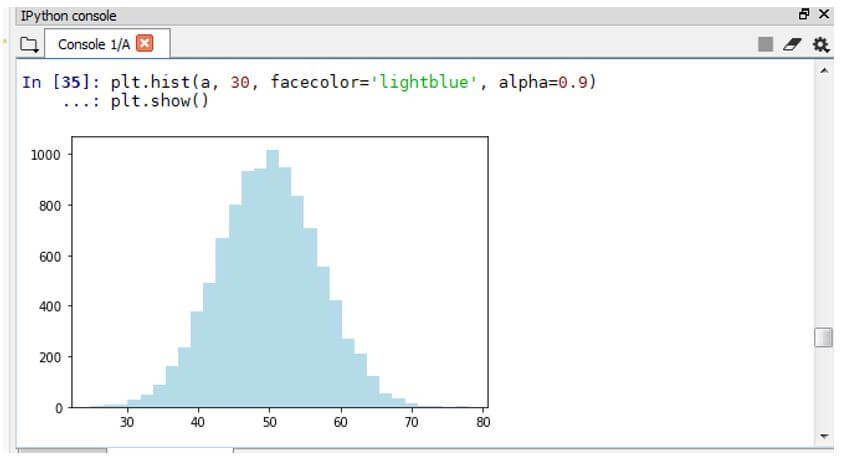
We have generated a more normal distribution and plotted the distribution using the matplotlib library.
Code:
import numpy as np
N, mean, sigm = 10000, 50, 7
a = mean + sigm*np.random.randn(N)
plt.hist(a, 30, facecolor='lightblue', alpha=0.9)
plt.show()
import numpy as np
b= np.random.randn(1000)
plt.hist(b, 100, facecolor='violet', alpha=0.9)
plt.show()Output:
Conclusion
In this article, we have seen NumPy normal distribution function using the numpy random object in detail using various examples to get a clear understanding of the numpy normal distribution function and its uses. We have also seen how to use normal distribution can be generated using various parameters and different techniques involved in generating the normal distribution array. Finally, we have also used various visualization libraries like matplotlib and seaborn to plot the resulting distribution with examples.
Recommended Articles
This is a guide to NumPy Normal Distribution. Here we discuss the introduction to NumPy Normal Distribution along with examples, respectively. You may also have a look at the following articles to learn more –
