Updated July 25, 2023
Definition of OIBDA
The acronym “OIBDA” stands for Operating Income Before Depreciation and Amortization. As such, OIBDA refers to the financial metric that measures a company’s operational efficiency during a given period (usually a year) while excluding the impact of capital spending and tax structure.
In other words, Operating Income Before Depreciation and Amortization indicates the profit generated by the company’s core operation that will eventually cover the working capital requirement and debt obligation payment.
Since GAAP regulations do not mandate OIBDA, companies usually do not report it as part of their financial filing. However, it can be calculated based on the information provided in the income statement. An increasing Operating Income Before Depreciation and Amortization may indicate either improving scale, profitability, or a combination of both.
Formula
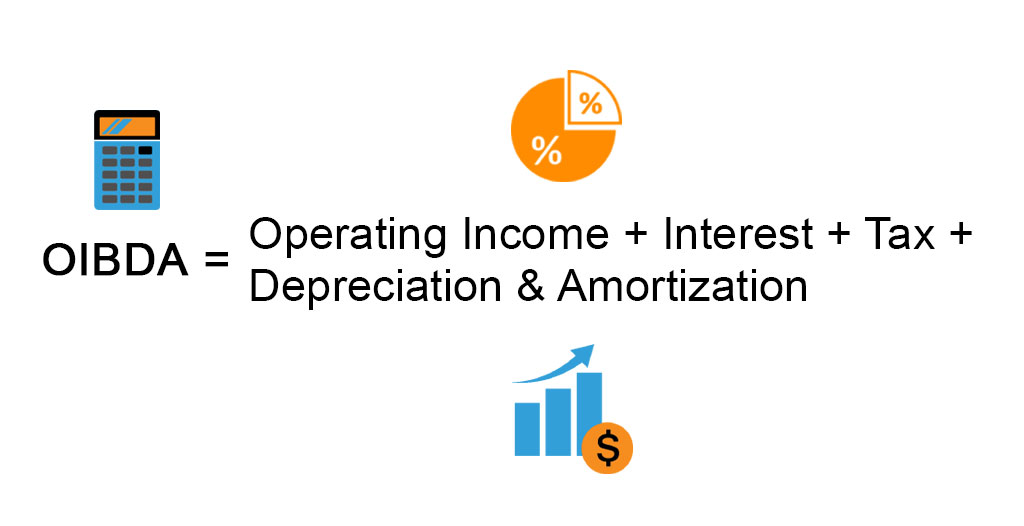
The formula for Operating Income Before Depreciation and Amortization can be derived by adding back interest, tax, and depreciation & amortization to the operating income that excludes income from non-recurring sources. The Mathematical representation of the formula is as below:
Examples of OIBDA (With Excel Template)
Let’s take an example to understand the calculation of the Operating Income Before Depreciation and Amortization in a better manner.
Example #1
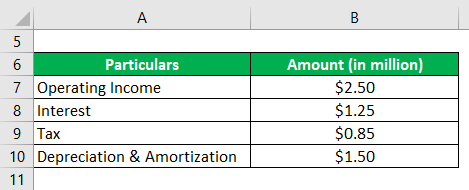
Let us take the example of a company named SDF Inc. to illustrate the computation of OIBDA. The company manufactures leather shoes in the village of Wheeling, Illinois (USA). According to the company’s annual report for the year 2018, its operating profit (net of non-recurring income) during the year was $2.50 million, while it incurred interest expense of $1.25 million, depreciation & amortization of $1.50 million and paid taxes of $0.85 million. Calculate the OIBDA of the company based on the given information.
Solution:
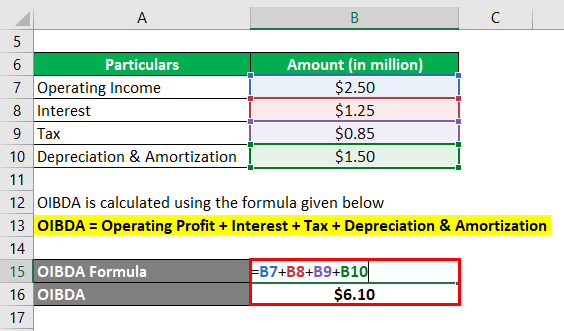
The formula to calculate OIBDA is as below:
OIBDA = Operating Profit + Interest + Tax + Depreciation & Amortization
- = $2.50 million + $1.25 million + $0.85 million + $1.50 million
- = $6.10 million
Therefore, SDF Inc. booked an OIBDA of $6.10 million during the year.
Example #2
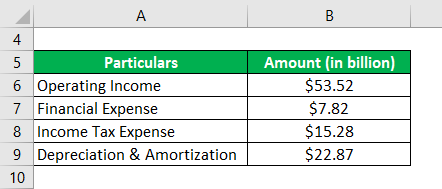
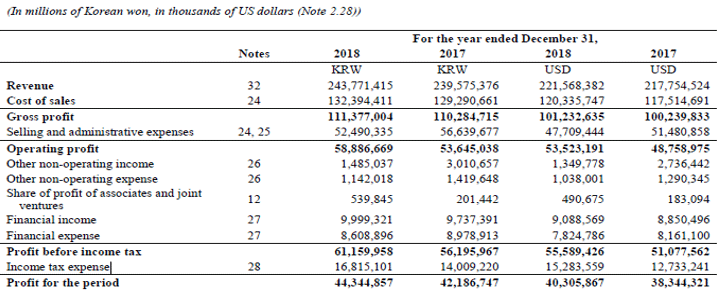
Let us take the example of Samsung’s annual report for the year 2018. As per the income statement, the company generated an operating profit of $53.52 billion during the year while incurring the financial expense of $7.82 billion, depreciation & amortization expense of $22.87 billion, and paid income tax of $15.28 billion. Calculate the OIBDA booked by Samsung during the year.
Solution:
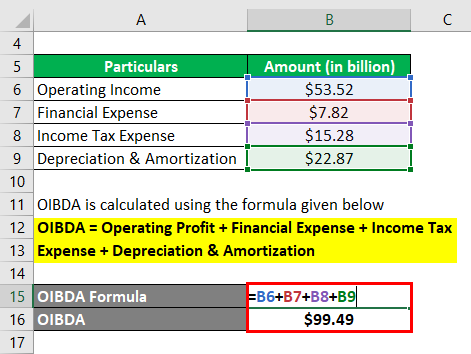
The formula to calculate OIBDA is as below:
OIBDA = Operating Profit + Financial Expense + Income Tax Expense + Depreciation & Amortization
- = $53.52 billion + $7.82 billion + $15.28 billion + $22.87 billion
- = $99.49 billion
Therefore, Samsung managed OIBDA of $99.49 billion during the year.
Sources Link: Samsung Balance Sheet
Example #3
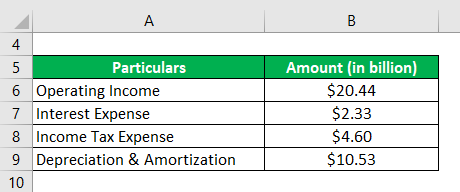
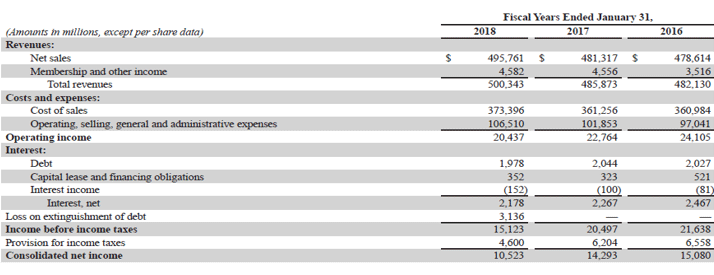
Let us take the example of Walmart Inc.’s annual report for the year 2018 to check its OIBDA during the year. As per the company’s income statement for the year 2018, the company generated an operating income of $20.44 billion while incurring interest expense of $2.33 billion, depreciation & amortization of $10.53 billion, and paid income taxes of $4.60 billion. Determine the OIBDA of Walmart Inc. for the year based on the given information.
Solution:
The formula to calculate OIBDA is as below:
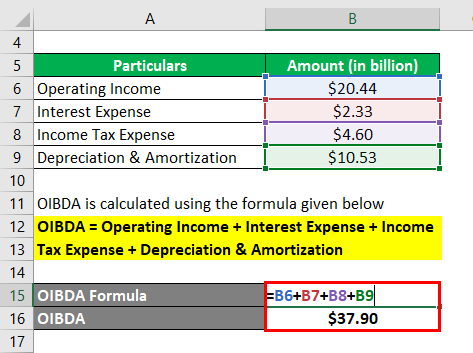
OIBDA = Operating Income + Interest Expense + Income Tax Expense + Depreciation & Amortization
- = $20.44 billion + $2.33 billion + $4.60 billion + $10.53 billion
- = $37.90 billion
Therefore, Samsung managed OIBDA of $37.90 billion during the year.
Source: Walmart Annual Reports (Investor Relations)
Advantages of OIBDA
Some of the advantages of OIBDA are:
- It allows the analyst to measure the profit generated by the business’s core operation.
- OIBDA can be useful in monitoring the performance of an entity over a period of time.
- It can be used as a better proxy for EBITDA as it excludes the income/expenses of non-core businesses.
Limitations of OIBDA
Some of the limitations of OIBDA are:
- Since it is a non-GAAP financial metric, there is no standard benchmark for calculation. As such, companies may manipulate the OIBDA figure for their own benefit.
- It is an absolute dollar metric, so one must be careful about the scale of operation while conducting any kind of peer analysis. If the scale of operations varies significantly, it might be impossible to draw any meaningful conclusion.
Conclusion
So, OIBDA is another useful financial metric used (not often) by companies to measure the efficiency of its operation. However, in the case of peer analysis, one must select a peer of a similar scale to draw meaningful insights.
Recommended Articles
This is a guide to the OIBDA. Here we discuss how it can be calculated using a formula, a downloadable Excel template, and the Advantages and Limitations of OIBDA. You can also go through our other suggested articles to learn more –
