Updated April 20, 2023
Introduction to OpenCV kmeans
Kmeans algorithm is an iterative algorithm used to cluster the given set of data into different groups by randomly choosing the data points as Centroids C1, C2, and so on and then calculating the distance between each data point in the data set to the centroids and based on the distance, all the data points closer to each centroid is labeled with 0, 1 and so on and then the average of all the data points labeled with 0, 1 and so on is calculated separately and made as the new centroid C1, C2 and so on and the same process is repeated until the centroids are converged to a fixed point.
Syntax:
cv.kmeans(samples, nclusters(k), criteria, attempts, flags)where samples are the set of data that is to be grouped into clusters,
- nclusters(k) is the number of clusters into which the given set of data must be grouped,
- criteria are the criteria based on which the algorithm iteration terminates,
- attempts specifies the number of times the algorithm is executed with different centroids and
- flags specify how the centroids are chosen.
Working of kmeans algorithm in OpenCV?
Working of kmeans algorithm in OpenCV is as follows:
- The kmeans algorithm starts by randomly choosing the data points as Centroids C1, C2, and so on.
- Then it calculates the distance between each data point in the data set to the centroids.
- Then all the data points closer to each centroid are grouped by labeling them with 0, 1, and so on.
- Then the average of all the data points labeled with 0, 1, and so on are calculated separately and the result is made as the new centroid C1, C2, and so on.
- The same procedure is repeated until the centroids are converged to a fixed point.
- The sum of the distances between each data point and their corresponding centroids must be minimum.
- The set of data to be clustered into different groups using kmeans algorithm must be of np.float32 data type.
- The criterion for termination of iteration is a tuple of three parameters namely type, max_iter, and epsilon.
- The parameter type specified the type of criteria for termination which has three flags.
- The three flags for type of termination criteria are cv.TERM_CRITERIA_EPS, cv.TERM_CRITERIA_MAX_ITER and cv.TERM_CRITERIA_EPS + cv.TERM_CRITERIA_MAX_ITER.
- The parameter type max_iter specifies the maximum number of iterations.
- The parameter type epsilon specifies the accuracy that is required.
- The parameter attempts returns the compactness as the output.
- Two flags are used to choose the centroids initially, they are KMEANS_PP_CENTERSand cv.KMEANS_RANDOM_CENTERS.
Examples
Let us discuss examples of OpenCV kmeans.
Example #1
OpenCV program in python to demonstrate the application of kmeans algorithm by creating a data set consisting of a single feature and then apply kmeans() function to group the created data set into two clusters by specifying the type of termination criteria, maximum number of iterations, epsilon, attempts and flags and plot the resulting clusters along with their corresponding centroids as the output on the screen:
Code:
#importing the modules numpy, cv2 and pyplot
import numpy as np
import cv2 as cv
from matplotlib import pyplot as plt
#creating a two dimensional array consisting of 50 elements in the range 0-255
first = np.random.randint(20, 100, 25)
second = np.random.randint(170, 255, 25)
#stacking the two arrays into a single array
resarray = np.hstack((first, second))
#reshaping the resulting array to a column vector
resarray = resarray.reshape((50, 1))
#converting the type of the resulting array to np.float32
resarray = np.float32(resarray)
#defining the termination criteria with type, max_iter and epsilon
criteria = (cv.TERM_CRITERIA_EPS + cv.TERM_CRITERIA_MAX_ITER, 20, 2.0)
# specifying the flag to choose the centroids
flags = cv.KMEANS_RANDOM_CENTERS
#applying kmeans function to cluster the given set of date into two clusters
compactness, labels, centers = cv.kmeans(resarray, 2, None, criteria, 20, flags)
#plotting the graph of two clusters against labels with one cluster in black color, another cluster in yellow color and centroids in red color
cluster1 = resarray[labels==0]
cluster2 = resarray[labels==1]
plt.hist(cluster1, 256, [0, 256], color='black')
plt.hist(cluster2, 256, [0, 256], color='yellow')
plt.hist(centers, 32, [0, 256], color='red')
plt.show()
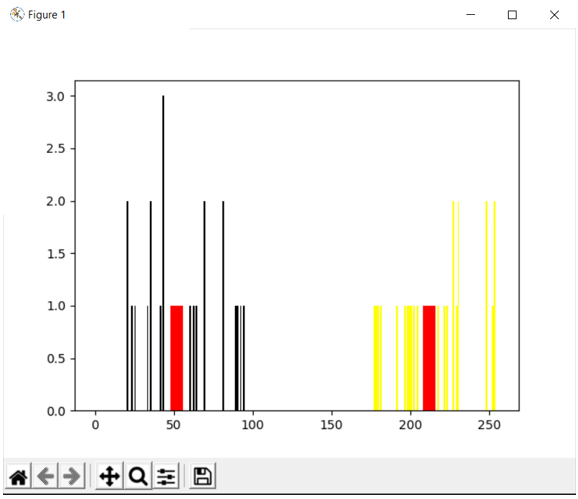
The output of the above program is shown in the snapshot below:
In the above program, we are creating a two-dimensional array and converting it into a column vector and then applying kmeans() function on the created data set to group the data set into two clusters, and the resulting two clusters along with their corresponding centroids is plotted in a graph and displayed as the output on the screen.
Example #2
OpenCV program in python to demonstrate the application of kmeans algorithm by creating a data set consisting of a single feature and then apply kmeans() function to group the created data set into three clusters by specifying the type of termination criteria, maximum number of iterations, epsilon, attempts and flags and plot the resulting clusters along with their corresponding centroids as the output on the screen:
Code:
#importing the modules numpy, cv2 and pyplot
import numpy as np
import cv2 as cv
from matplotlib import pyplot as plt
#creating a two dimensional array consisting of 50 elements in the range 0-255
first = np.random.randint(0, 100, 30)
second = np.random.randint(100, 255, 30)
#stacking the two arrays into a single array
resarray = np.hstack((first, second))
#reshaping the resulting array to a column vector
resarray = resarray.reshape((60, 1))
#converting the type of the resulting array to np.float32
resarray = np.float32(resarray)
#defining the termination criteria with type, max_iter and epsilon
criteria = (cv.TERM_CRITERIA_EPS + cv.TERM_CRITERIA_MAX_ITER, 20, 2.0)
# specifying the flag to choose the centroids
flags = cv.KMEANS_RANDOM_CENTERS
#applying kmeans function to cluster the given set of date into two clusters
compactness, labels, centers = cv.kmeans(resarray, 3, None, criteria, 20, flags)
#plotting the graph of three clusters against labels with one cluster in black color, another cluster in yellow color and the last cluster in green color and centroids in red color
cluster1 = resarray[labels==0]
cluster2 = resarray[labels==1]
cluster3 = resarray[labels==2]
plt.hist(cluster1, 256, [0, 256], color='black')
plt.hist(cluster2, 256, [0, 256], color='yellow')
plt.hist(cluster3, 256, [0, 256], color='green')
plt.hist(centers, 32, [0, 256], color='red')
plt.show()
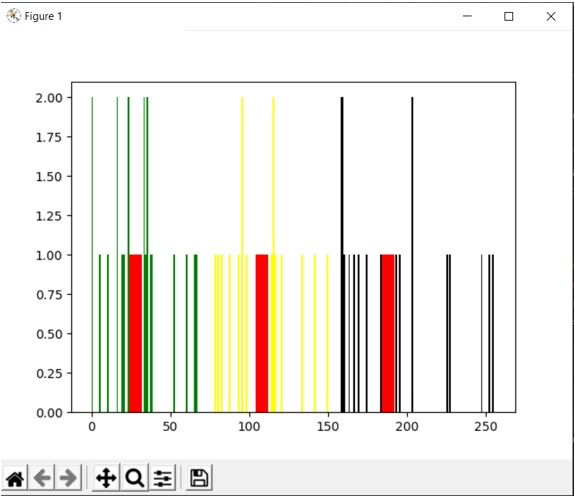
The output of the above program is shown in the snapshot below:
In the above program, we are creating a two-dimensional array and converting it into a column vector and then applying kmeans() function on the created data set to group the data set into three clusters, and the resulting three clusters along with their corresponding centroids is plotted in a graph and displayed as the output on the screen.
Conclusion
In this article, we have learnt the concept of kmeans algorithm through definition, syntax, and working of kmeans algorithm with corresponding programming examples and their outputs to demonstrate them.
Recommended Articles
We hope that this EDUCBA information on “OpenCV kmeans” was beneficial to you. You can view EDUCBA’s recommended articles for more information.


