Updated July 4, 2023
What is Option Chain?
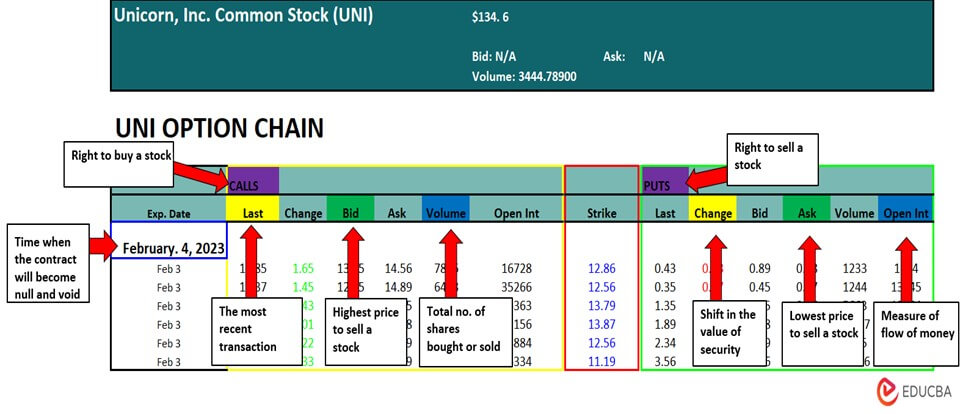
An Option Chain or Option Matrix is a complete listing of all the available option contracts for any given asset, such as a stock, a commodity, an index, a currency, etc. It gives a snapshot of all the important statistics pertaining to a stock option in a single window.
Traders can analyze it to draw meaningful insights about the stock and determine its movement in the near future. Interested traders can access the option chain easily for any given asset through various websites (e.g.: NASDAQ, Yahoo Finance, etc.).
Moreover, it helps traders evaluate the liquidity and depth of an option contract at any given strike price. The index can use it as an advance warning system for sharp moves. Also, it can be very useful in building an option strategy, such as strangles, at different strike prices.
For example, Smith, a trader, wants to buy some stocks on a large scale. He can use the option chain to check all the available stock options’ details. Smith will have access to all the trading activities, including volume of interest, frequency, maturity months, etc. He will also be able to assess the liquidity of the strikes.
Key Highlights
- An option chain table displays complete data for a given underlying security on a specific date.
- The expiration date updates the option chain data and includes information about the last price, trading value, calls, puts, etc.
- The strike price of a commodity shows the stock price at which a trader can buy the stock.
- A trader can look for specific options needed to fulfill a particular strategy.
Understanding Option Chain Components
There are four columns in the option chain that traders usually focus on to analyze the current market situation. These columns are; Net Change, Bid, Ask, and Last Price.
- The last price column shows the most recent trade price that was recorded and reported.
- The analysis of the bid column provides details regarding the possible return on the sale of that option within that time.
- The ask column contains information on the price the trader might anticipate spending to buy that option at that moment.
- The information in the net change column shows the direction (up, down, or flat) for the underlying asset and the variation in an amount from the last trade.
How to Read the Option Chain?
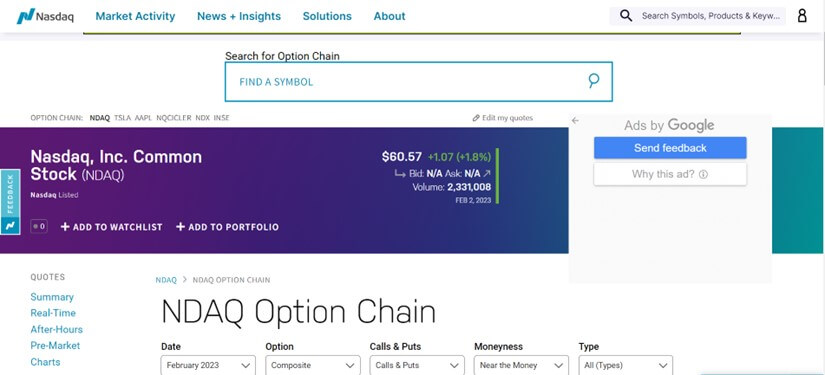
Step #1: Visit Nasdaq to begin with your option chain.
Step #2: You can search for your desired option from the “Find A Symbol” bar. We are going to do an analysis of Tesla.Inc.
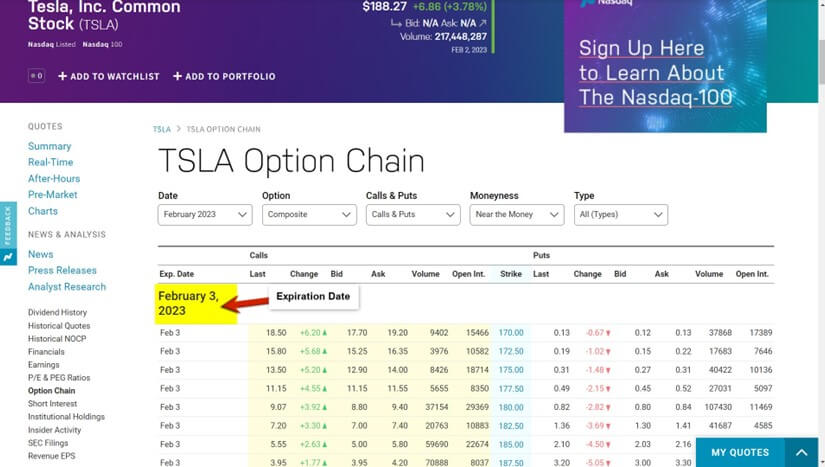
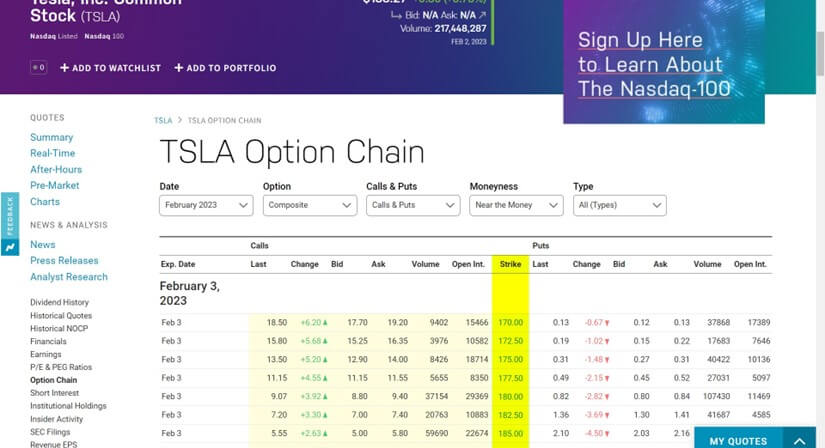
Step #3: The option chart of Tesla.Inc will open like this, and it has an expiration date of February 3, 2023.
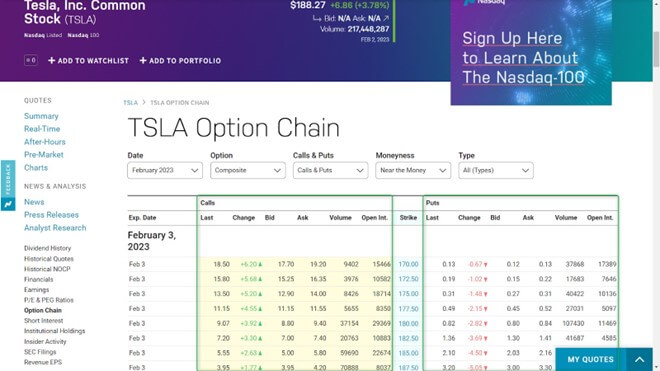
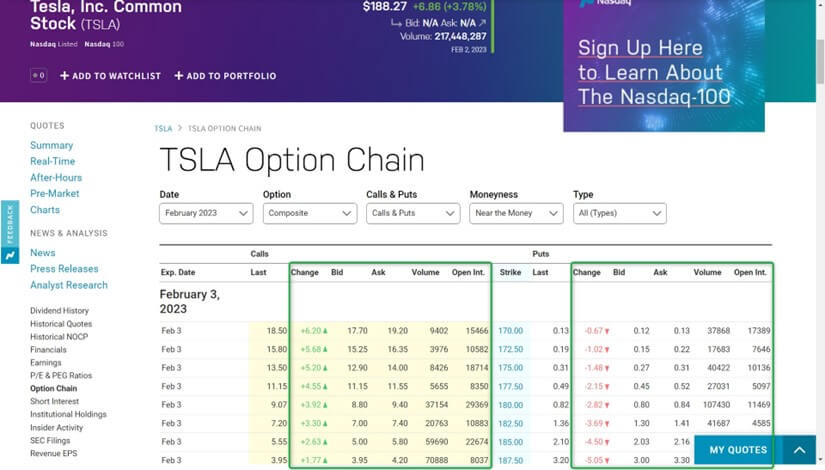
Step #4: The Chart is divided into Call and Put Options. We have the data for Call Options on the left side and the data for Put Options on the right side.
Step #5: In the centre, we have the strike prices mentioned
Step #6: On either side of the strike prices, we have various details like Change, Bid, Ask, Volume, and Open Int.
Examples of Option Chain
#1 Apple Inc. (AAPL)
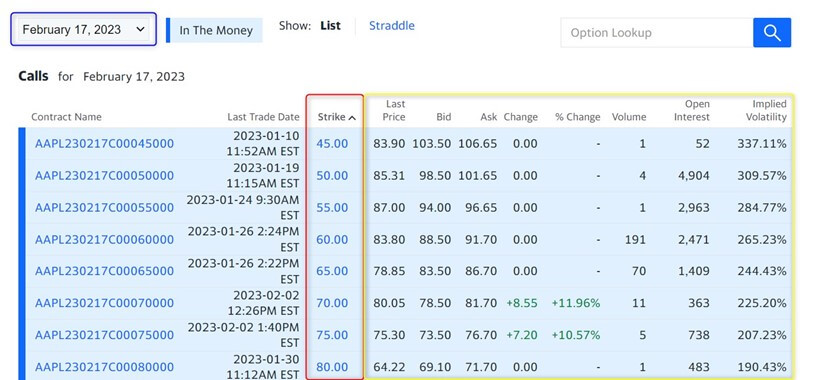
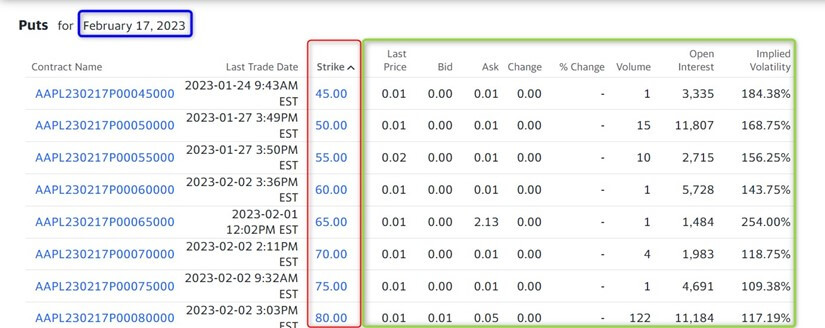
Let us take the example of Apple Inc. stock to offer a snapshot of how the option chain looks for a real-life entity.
(Source: finance.yahoo.com)
We can make the following conclusions from the option chains of W&T Offshore Inc.:
- Apple Inc. is trading at $150.82 on Feb 3, 2023, highlighted in light blue.
- The expiry date of the option chain is Feb 17, 2023, highlighted in dark blue.
- The strike prices of both call and put options range from 00 to 80.00, highlighted in red.
- The columns that help investors with calls are in yellow, while those for puts are in green.
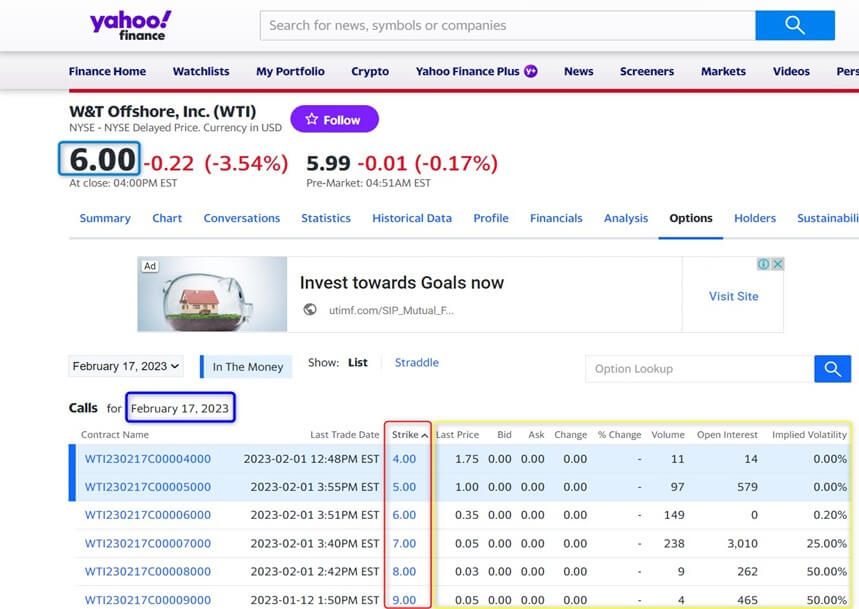
#2 W&T Offshore, Inc. (WTI)
Let us take the example of W&T Offshore, Inc. stock to offer a snapshot of how the option chain looks for a real-life entity.
(Source: finance.yahoo.com)
We can make the following conclusions from the option chains of W&T Offshore Inc.:
- W&T Offshore, Inc. is trading at $6.00 on Feb 3, 2023, highlighted in light blue.
- The expiry date of the option chain is Feb 17, 2023, highlighted in dark blue.
- The strike prices of both call and put options range from 00 to 9.00, highlighted in red.
- The columns that help investors with calls are in yellow, while the columns that help with puts are in green.
Features
#1 Contract name: It is the unique name given to the contract for the purpose of identification.
#2 Last trade date: It precisely specifies the date and time of the last trade of the given security.
#3 Strike price: It is one of the most important pieces of information about an option contract. Strike price refers to the agreed price at which the buyer of the option will buy or sell the security on an agreed future date.
#4 Last traded price: It is the price at which the given security (of the option contract) was last traded, mostly the stock’s closing price at the end of the day.
#5 Bid price: It captures the highest bid for the option contract in the market. In other words, it is the best price that a trader is ready to pay to purchase the option contract.
#6 Ask price: It captures the highest ask placed by the seller in the market for the option contract. In other words, it is the best price at which a trader is ready to sell the option contract.
#7 Change in last traded price: It shows the difference between the latest, last traded price and the previous last traded price of the option contract. The change is considered positive if the latest last traded price is higher than the previous last traded price, and vice versa.
#8 Volume: It indicates the number of contracts of the given option contract that have been traded in the market during a particular period of time. Higher volume indicates better liquidity of the option contract in the market.
#9 Open Interest: It represents the number of open positions for a given option contract. An open position means that it is yet to be closed out, exercised, or expired.
Final Thoughts
Option chain gives a sneak peek of the future of stock by providing various information about all its available option contracts. However, the expertise to read between the lines of the option chain can only be gained over a period of time.
Frequently Asked Questions (FAQs)
Q.1 What should I check in the option chain?
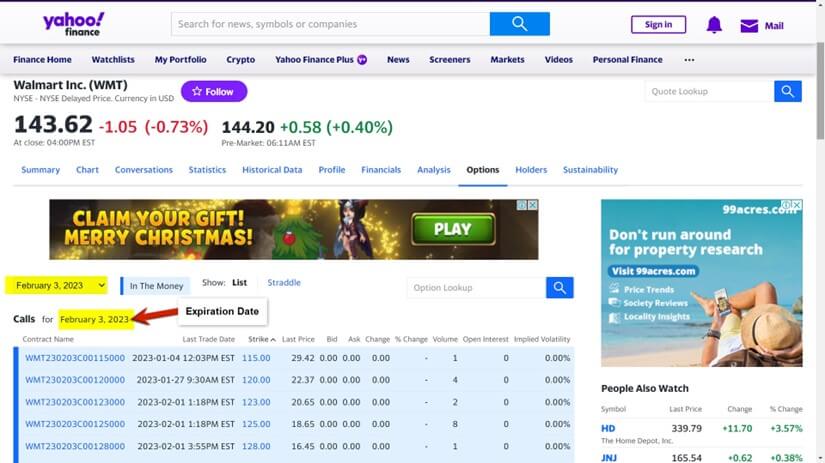
Answer: Typically, you should check expiration dates in option chains. Different options symbols are used for options contracts on the same stock that have various expiration dates.
Here is an example of an option chain of Walmart Inc.
Q.2 What is the ask Qty in the option chain?
Answer: There is Ask & Buy qty in the option chain. Ask Qty is the quantity of active sell orders at a given strike price and provides information on the supply for the option. Whereas the Bid Qty is the quantity of buy orders for a certain strike price and provides information on the current demand for an option’s strike price.
Q.3 How to understand option chain data?
Answer: Option chain data gives complete information related to option strikes of a particular stock or index in a single frame. In the frame, the strike price is at the centre and all other information related to calls and puts on the similar strike are placed next to each other.
Q.4 What are Calls and Puts?
Answer: Calls and puts are the two subcategories of an option chain. A put option gives the right to sell a stock, whereas a call option gives the right to buy it. The upfront price an investor pays to purchase an option is the premium, which is the cost of an options contract.
Q.5 Why do people prefer options trading?
Answer: People prefer options trading for many reasons but primarily because of the less risky factor. Options can be less risky for investors than equities since they demand less financial commitment and are more resistant to the potentially destabilizing impacts of gap openings. Also, options are safer than stocks since they are the most reliable type of hedge.
Recommended Articles
This is a guide to Option Chain. Here we also discuss the introduction and how to find the option chain along with examples and features. You may also have a look at the following articles to learn more –
