Updated February 10, 2023
Definition
“Outlier is an observation in a dataset situated at an abnormal distance from other values in the exact same dataset.” In data mining, outliers are considered significant because they can remarkably impact the analysis and modeling of data. Therefore, it is essential to identify and handle outliers appropriately to ensure accurate results.
What is Outlier in Data Mining?
Essentially, an outlier is a data point that is remarkably distinct from other data points in a dataset. It can be caused by errors, such as measurement errors or data entry errors, or it can be a legitimate observation that is simply rare or unusual. In data mining, outliers can significantly impact the results of an analysis or model. For example, suppose an outlier is present in a dataset used for regression analysis. In that case, it can significantly affect the regression line and its coefficients, leading to incorrect or misleading results. Outliers can also affect the performance of clustering algorithms or change the distribution of data, leading to incorrect results. That’s why it’s important to identify and handle outliers appropriately, for example, by removing them or transforming the data, to ensure accurate results in data mining.
Key Takeaways
- They are caused by errors in measurement or data entry or represent legitimate observations.
- They significantly impact the data analysis and modeling, leading to incorrect results.
- They are identified using methods, such as the Z-score, the interquartile range, or the Mahalanobis distance.
- They are handled in many ways, such as by removing them, transforming the data, or using robust statistical methods less sensitive to outliers.
- Outlier detection and handling are essential for accurate data preprocessing in data mining.
Types of Outliers in Data Mining
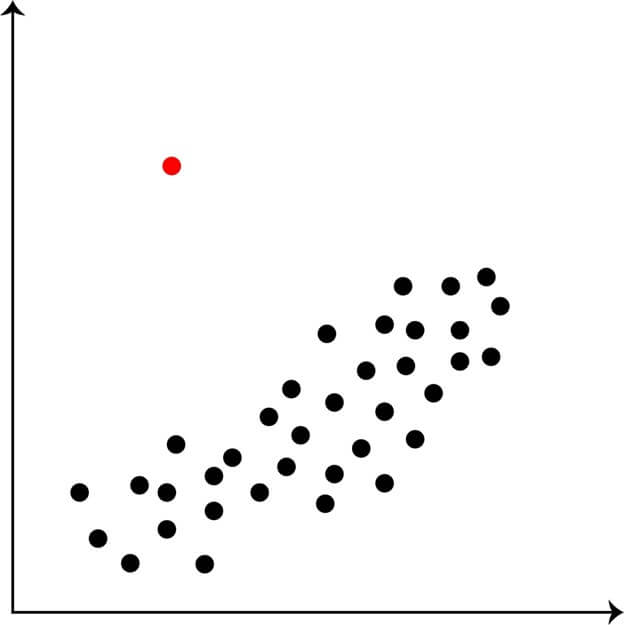
1. Univariate Outliers
Univariate outliers are observations that lie significantly outside the range of the majority of the data points in a single variable dataset. This means they have an unusually high or low value compared to the remainder of the data in that single variable.
- For example, in a dataset of height measurements of 100 people, if one person is significantly taller or shorter than the majority of the other people, they would be considered a univariate outlier.
- Univariate outliers are particularly important in fields such as medical research, where they can indicate unexpected or unusual results, and financial analysis, which can indicate fraud or anomalies. Properly handling univariate outliers is essential for ensuring accurate results in data analysis and drawing meaningful conclusions from the data.
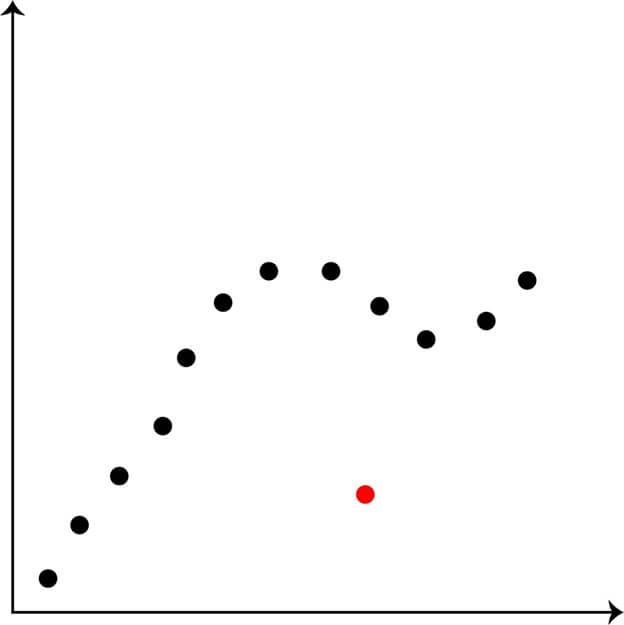
2. Contextual Outliers
Contextual outliers refer to data points that deviate significantly from the norm in the context of a specific dataset. These outliers are different from univariate outliers, which are based on a single variable and may be outliers in that single dimension but are not necessarily outliers in the context of the dataset as a whole.
- Contextual outliers are determined by considering multiple variables in a dataset and their relationships with each other.
- For example, in a dataset of housing prices, a house may be considered a contextual outlier if its price is significantly different from other houses in the same neighborhood with similar features, such as the number of rooms, the exact square footage, and the age of the property.
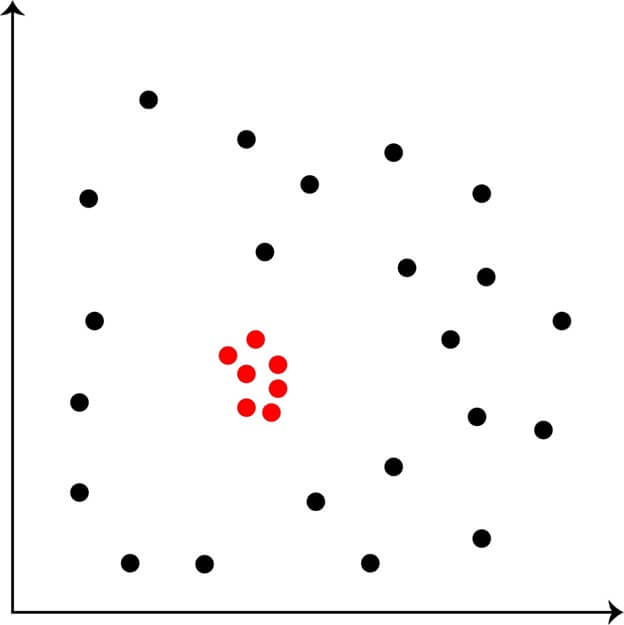
3. Collective Outliers
Collective outliers refer to a group of observations that deviate significantly from the norm within a dataset. Unlike individual outliers, which are isolated observations that differ from the remaining data, collective outliers represent a pattern of unusual observations occurring together.
- Collective outliers can be identified through various statistical methods, such as clustering algorithms or outlier detection techniques. These methods take into account the relationships between variables and can detect groups of observations that deviate from the norm in a similar way.
- Collective outliers can have a significant impact on the results of data analysis, leading to incorrect or misleading conclusions if they are not properly handled. In some cases, collective outliers may indicate a problem with the data collection or measurement process, or they may represent a genuine, but unusual pattern in the data.
How to Detect Outlier in Data Mining?
There are several methods for detecting outliers in data mining, including:
1. Z-score Method
Here this method calculates and determines the Z-score for each and every data point, which would be the number of standard deviations- a data point is from the mean. Outliers are identified as data points with Z-scores greater than a certain threshold, typically 3 or -3.
- The steps to calculate the Z-score are: finding the mean of the dataset, and computing the standard deviation.
- Calculate the Z-score for each data point by subtracting the mean and dividing the result by the standard deviation.
- Identifying outliers as data points with a Z-score equal to or above a certain threshold, usually 3 or -3. This method assumes a normal data distribution and may not be suitable for non-normal datasets.
For example, if the mean of the dataset is 100 and the normal or usual deviation is 10, a data point with a value of 140 would have a Z-score of 2 (140-100)/10= 2. This Z-score indicates that the data point is 2 standard deviations above the mean and could be considered an outlier.
2. Interquartile Range (IQR) Method
The Interquartile Range (IQR) method is a way to detect outliers in a dataset by dividing it into quartiles and measuring the variability of the middle 50% of the data.
- It involves the following steps: calculating the first quartile (Q1) and third quartile (Q3),
- Finding the IQR by subtracting Q1 from Q3
- Identifying outliers as data points outside the Q1 – 1.5 * IQR range to Q3 + 1.5 * IQR.
- This method is simple to use and commonly applied; however, it assumes a symmetrical distribution of data and may not accurately identify outliers in non-symmetrical datasets.
For example, consider a dataset with the following values: 2, 3, 4, 5, 6, 7, 8, 9. The Q1 would be 4, the Q3 would be 8, and the IQR would be 8 – 4 = 4. Data points below 2 (Q1 – 1.5 * IQR) or above 11 (Q3 + 1.5 * IQR) would be considered outliers.
3. Mahalanobis Distance Method
This method uses multivariate statistics to calculate the distance of each data point from the mean of the dataset. Outliers are identified as data points with distances greater than a certain threshold.
- The method involves finding the mean and covariance matrix
- Calculating the Mahalanobis distance for each data point,
- Identifying outliers based on a threshold determined by statistical tests.
- This method is effective for datasets with normal distributions but may not be suitable for non-normal datasets.
Taking an example of a dataset of people’s height and weight. We want to find out who is significantly different from the average height and weight of the group. We first find the average height and weight of the group, then for each person, you calculate their distance from the average based on both height and weight, considering how the two variables are related. People with a large distance from the average are considered outliers. So, for example, if most people in the group are around average height and weight, but one person is both much taller and much heavier than the average, this person would be identified as an outlier using the Mahalanobis distance method.
4. DBSCAN (Density-Based Spatial Clustering of Applications with Noise)
This clustering algorithm identifies outliers as data points that do not belong to any dense clusters.
- DBSCAN has several key parameters: the radius (eps) around each point that defines the neighborhood and the minimum number of points (minPts) required to form a cluster. These parameters can be adjusted to control the size and number of clusters produced by the algorithm.
- One advantage of DBSCAN is its ability to find clusters of arbitrary shapes, unlike other algorithms like k-means which are limited to finding spherical clusters.
- DBSCAN is also less sensitive to the number of clusters specified in advance, making it a good choice for datasets where the number and shape of clusters are unknown.
- However, DBSCAN can be sensitive to the choice of parameters and may not work well for datasets with large numbers of overlapping clusters. In these cases, other clustering algorithms or a combination of multiple algorithms may be necessary.
5. Local Outlier Factor (LOF)
This algorithm calculates the local density of each data point, and identifies outliers as data points with low local density relative to their neighbors. One advantage of the LOF algorithm is that it can detect global and local outliers. Global outliers are data points far from the majority of data points in the entire dataset. In contrast, local outliers are data points that are distant from their nearest neighbors, even if they are not far from the majority of the data points.
- Suppose we have a dataset containing the heights and weights of 100 people. We want to use the LOF algorithm to identify any outliers in this dataset.
- First, we would choose a value for a few nearest neighboring data points to calculate the local density score. For this example, let’s use 5 nearest neighbors.
- Next, we would calculate the local density score for each person in the dataset using their height and weight and the heights and weights of their 5 nearest neighbors.
- Finally, we would compare the local density scores of each person to determine if they are outliers. If a person has a local density score that is significantly lower than the scores of their 5 nearest neighbors, they would be considered an outlier.
- For example, if person A has a height of 6 feet and a weight of 200 pounds and their 5 nearest neighbors all have heights between 5 feet and 6 feet and weights between 150 and 170 pounds, person A would be considered an outlier because their height and weight are significantly different from those of their nearest neighbors.
These above methods are utilized as a single or in coalition to identify outliers in a dataset. The types of methods used will depend on the data’s nature and the analysis’s goals.
Outlier Analysis in Data Mining
Outlier analysis in data mining is identifying, describing, and handling outliers in a dataset. Outlier analysis aims to identify observations significantly different from the majority of the data points and to determine whether these outliers represent errors, outliers, or exciting phenomena. Outlier scrutiny is a crucial step in data preprocessing, as outliers can hugely impact data analysis and modeling outcomes.
The procedure of outlier analysis generally includes the following steps:
- Data preparation: The first step is to prepare the data for analysis, including cleaning and transforming the data as needed.
- Outlier detection: The next step is to use statistical methods, such as the Z-score method, the interquartile range method, or the Mahalanobis distance method, to identify outliers in the data.
- Outlier investigation: Once outliers have been identified, the next step is to investigate why they are outliers, and to determine whether they represent errors, outliers, or interesting phenomena.
- Outlier handling: The final step is to handle the outliers, depending on the investigation results. This can include removing the outliers, transforming the data, or using robust statistical methods that are less sensitive to outliers.
Outlier analysis is a crucial step in data mining, as it helps to ensure that data analysis and modeling results are accurate and meaningful. By identifying and handling outliers, researchers, and analysts can avoid drawing incorrect conclusions from the data.
Causes of Outliers in Data Mining
There are several common causes of outliers in data mining, including:
- Measurement error: Outliers can be caused by errors in the measurement or recording of data, such as typos, misreadings, or incorrect data entry.
- Natural variability: Outliers can also be caused by natural variability in the data, such as extreme values in a normally distributed dataset, or unusual events that are not representative of the underlying population.
- Data collection issues: Outliers can be caused by issues with the data collection process, such as sampling bias, incomplete data, or errors in data collection methods.
- Data anomalies: Outliers can be caused by data anomalies, such as missing values, incorrect values, or outliers representing errors or anomalies in the data.
- Model limitations: Outliers can also be caused by limitations in the models used for data analysis and modeling, such as oversimplification of the data or inappropriate assumptions about the data.
It is important to understand and identify the causes of outliers in data mining, as this information can be used to inform decisions about how to handle outliers and ensure that the results of data analysis and modeling are accurate and meaningful.
Importance of Outlier Analysis in Data Mining
Outlier analysis is important in data mining for several reasons:
- Improving data quality: Outlier analysis helps to identify and correct errors in the data, improving the overall quality of the data and increasing the reliability of data analysis and modeling.
- Enhancing understanding of the data: Outlier analysis can reveal interesting patterns and relationships in the data that might be missed when only looking at the central tendencies.
- Improving accuracy of statistical models: Outliers can significantly impact the results of statistical models, and by identifying and handling outliers, the accuracy of the models can be improved.
- Preventing misleading results: Outliers can significantly impact the results of data analysis and modeling, and by identifying and handling outliers, researchers, and analysts can avoid drawing incorrect conclusions from the data.
- Detecting fraud and anomalies: Outlier analysis can be used to detect fraud and anomalies in the data, such as unusual transactions or unusual patterns of behavior, which can have important implications for security and business decision-making.
Overall, outlier analysis is an important step in data mining, as it helps to ensure that data analysis and modeling results are accurate and meaningful. By identifying and handling outliers, researchers, and analysts can draw valid conclusions from the data and make informed decisions based on the data.
Application
Outlier analysis has several practical applications in data mining, including:
- Fraud detection: Outliers can be used to identify unusual transactions or behavior that may indicate fraud, which can have important implications for security and business decision-making.
- Quality control: Outliers can be used to identify errors in the data, such as measurement errors or data entry errors, which can be corrected to improve the quality of the data.
- Customer behavior analysis: Outliers can be used to identify unusual behavior patterns in customer data, such as unusual spending patterns or usage patterns, which can inform marketing and customer service strategies.
- Healthcare analysis: Outliers can be used to identify unusual patient outcomes or unusual treatment outcomes, which can inform clinical decision-making and quality improvement efforts.
- Financial analysis: Outliers can be used to identify unusual financial transactions or market movements, which can inform investment and risk management strategies.
- Environmental monitoring: Outliers can identify unusual environmental conditions, such as extreme weather events or unusual water quality readings, which can inform environmental management and mitigation strategies.
Outlier audit being a powerful tool for data mining, it too has applications in an extremely wide range of fields, including business, finance, healthcare, and environmental management. By identifying and handling outliers, researchers, and analysts can draw valid conclusions from the data and make informed decisions based on the data.
Conclusion
Outlier analysis plays a crucial role in data mining by identifying and managing atypical data points compared to the majority. It is crucial as it enhances data quality, promotes understanding of data, ensures accurate results in models, and detects anomalies. Proper outlier analysis leads to meaningful and accurate results, allowing for informed decision-making based on data.
Recommended Article
We hope that this EDUCBA information on “Outlier in data mining” was beneficial to you. You can view EDUCBA’s recommended articles for more information.


