Updated April 12, 2023

Introduction to Pandas DataFrame.describe()
A dataframe is a data structure formulated by means of the row, column format. There is a concrete necessity to determine the statistical determinations happening across these dataframe structures. The describe() method in the pandas library is used predominantly for this need. It allows determining the mean, standard deviation, unique values, minimum values, maximum values, percentiles, and many further analytical calculations for these pandas dataframes.
Syntax:
DataFrame.describe(self, percentiles=None, include=None, exclude=None)Parameter:
Below are the parameters of Pandas DataFrame.describe() in Python:
| Parameter | Description |
| Percentiles | Mentions the percentile value which needs to be followed for the dataframe. the value mentioned in the percentile should be within the range of 0 to 1. The default is [.25, .5, .75], which returns the 25th, 50th, and 75th percentiles. |
| Include | This is another excellent parameter or argument in the pandas describe() function. it mentions the datatypes which need to be considered for the operations of the describe() method on the dataframe. so when the describe calculates the mean, count, etc, it considers the items in the dataframe which strictly falls under the mentioned data type. For considering only the numeric items for the operations then this parameter needs to be set as numpy. number, if all the objects from the given dataframe are alone considered then this data type needs to be set as numpy.object data type. this argument also has the latency to operate on the column level. so only some specific columns from the dataframe can be included using this option. for mentioning only specific columns from a dataframe use the ‘category’ value here. the default value for this argument is None which means to consider all the numeric columns alone from the dataframe for the considered operation. This argument is ignored for the series data structure in the pandas library. |
| Exclude | This is another excellent parameter or argument in the pandas describe() function. it mentions the datatypes which need to be considered for the operations of the describe() method on the dataframe. so when the describe calculates the mean, count, etc, it excludes the items in the dataframe which strictly falls under the mentioned data type. For excluding only the numeric items for the operations then this parameter needs to be set as numpy. number, if all the objects from the given dataframe are alone excluded then this data type needs to be set as numpy.object data type. this argument also has the latency to operate on the column level. so only some specific columns from the dataframe can be excluded using this option. for mentioning only specific columns from a dataframe use the ‘category’ value here. the default value for this argument is None which means to exclude all the numeric columns alone from the dataframe for the operation performed. This is argument is again ignored for the series data structure in the pandas library. |
Examples to Implement Pandas DataFrame.describe()
Below are the examples of Pandas DataFrame.describe():
Example #1
Code:
import pandas as pd
Core_SERIES = pd.Series([ 'A', 'B', 'C', 'D', 'E', 'F'])
print("   THE CORE SERIES ")
print(Core_SERIES)
print("")
print(Core_SERIES.describe())
Output:
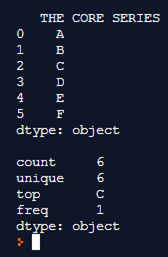
Explanation: The first example uses a pandas series data structure. this series data structure is composed of alphabetic string values, So as we notice the string values are alphabetic characters from A to F Once the series is completely formulated it is printed on to the console. The describe() function on the series determines the count value, unique characters in place, the frequency of occurrence of each of the characters the topmost character in the given series. These determined values are printed on to the console along with the data type value which is been handled. In this case, it is of type object.
Example #2
Code :
import pandas as pd
import numpy
Core_Dataframe = pd.DataFrame({'Emp_No' : [1,2,3,4],
'Employee_Name' :  ['Arun', 'selva', 'rakesh', 'arjith'],
'Employee_dept' : ['CAD', 'CAD', 'DEV', 'CAD']})
print("   THE CORE DATAFRAME ")
print(Core_Dataframe)
print("")
print(Core_Dataframe.describe(include=numpy.number))
Output:
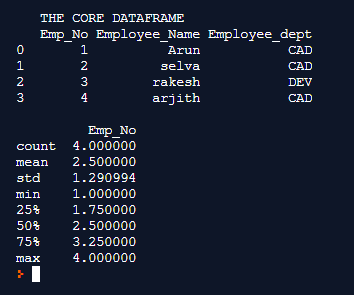
Explanation: In this example, the core dataframe is first formulated. pd.dataframe() is used for formulating the dataframe. Every row of the dataframe is inserted along with their column names. Once the dataframe is completely formulated it is printed on to the console. We can notice at this instance the dataframe holds details like employee number, employee name, and employee department. The describe() function offers the capability to flexibly calculate the count, mean, std, minimum value, the 25% percentile value, the 50% percentile value, the 75% percentile value and the maximum value from the given dataframe. The Include argument is associated with the value numpy.the number which means to include the integer values alone from the dataframe, In the above-drafted dataset since the Employee number column alone holds the integer values with it, so this column alone is considered for the describe() calculation.
Example #3
Code:
import pandas as pd
Core_Dataframe = pd.DataFrame({'A' :  [ 1, 6, 11, 15, 21, 26],
'B' :  [2, 7, 12, 17, 22, 27],
'C' :  [3, 8, 13, 18, 23, 28],
'D' :  [4, 9, 14, 19, 24, 29],
'E' :  [5, 10, 15, 20, 25, 30]})
print("   THE CORE DATAFRAME ")
print(Core_Dataframe)
print("")
print(Core_Dataframe.describe())
Output:
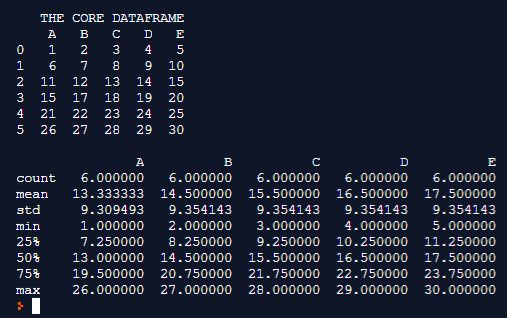
Explanation: In this example, the core dataframe is first formulated. pd.dataframe() is used for formulating the dataframe. Every row of the dataframe is inserted along with their column names. Once the dataframe is completely formulated it is printed on to the console. We can notice at this instance the dataframe holds a random set of numbers and alphabetic values of columns associated to it. With all items in the dataframe being of integer data type, so all the items are considered for the describe the () process. Again The describe() function offers the capability to flexibly calculate the count, mean, std, minimum value, the 25% percentile value, the 50% percentile value, the 75% percentile value, and the maximum value from the given dataframe and these values are printed on to the console.
Recommended Articles
We hope that this EDUCBA information on “Pandas DataFrame.describe()” was beneficial to you. You can view EDUCBA’s recommended articles for more information.


