Updated April 6, 2023

Introduction to Pandas DataFrame.groupby()
Grouping the values based on a key is an important process in the relative data arena. This grouping process can be achieved by means of the group by method pandas library. This method allows to group values in a dataframe based on the mentioned aggregate functionality and prints the outcome to the console. In pandas perception, the groupby() process holds a classified number of parameters to control its operation.
Syntax and Parameters
Syntax and Parameters of Pandas DataFrame.groupby():
Syntax:
DataFrame.groupby(self, by=None, axis=0, level=None, as_index: bool = True, sort: bool = True, group_keys: bool = True, squeeze: bool = False, observed: bool = False)Parameters:
| Parameter | Description |
| by | The argument ‘by’ operates as the mapping function for the groups. Here the groups are determined using the group by function. this argument also has the capability to hold a dictionary or a series with it so this means a dictionary or a series is operated over the by argument, so this grouping process will be performed based on this dict value. Even an array like a ndarray can be applied to this argument for achieving the grouping process. |
| axis | This argument represents the column or the axis upon which the groupBy() function needs to be applied. The value specified in this argument represents either a column position or a row position in the dataframe. To achieve this capability to flexibly travel over a dataframe the axis value is framed on below means, {index (0), columns (1)}. here mentioning the value of 0 to axis argument fills the rename values for each and every row in the dataframe, whereas mentioning the value of 1 in the dataframe fills the replacement values for all the columns in the dataframe. |
| level | This mentions the levels to be considered for the groupBy process, if an axis with more than one level is been used then the groupBy will be applied based on that particular level represented. |
| As_index | This is a Boolean representation, the default value of the as_index parameter is True. This is used only for data frames in pandas. The major use of the as_index parameter in pandas is to return objects with grouped labels as an index. |
| sort | This is the most important parameter from an optimization perspective. the sorted keyword is helpful in achieving greater performance by tuning the group keys passed in the input which allows them to achieve better performance. mentioning these sort keys has no impact in the order of each group’s observations. |
| Group_keyes | For identifying individual pieces of the group keys when apply is called. |
| squeeze | If the dimension of the return needs to be changed then the squeeze function must be used. |
| observed | This is another Boolean representation, the default value of the observed parameter is false. When the observed parameter is set to true then all the observed values are expected to be shown as a part of the grouping process, whereas setting this parameter to false will show all values of the categorical groups involved. |
Examples of Pandas DataFrame.groupby()
Following are the examples of pandas dataframe.groupby() are:
Example #1
Code:
import pandas as pd
import numpy as np
Core_Dataframe = pd.DataFrame({'Emp_No' : ['Emp1', np.nan,'Emp3','Emp4'],
'Employee_Name' :  ['Arun', 'selva', np.nan, 'arjith'],
'Employee_dept' : ['CAD', 'CAD', 'DEV', np.nan]})
print("   THE CORE DATAFRAME ")
print(Core_Dataframe)
print("")
print("   THE CORE DATAFRAME AFTER GROUP BY OPERATION ")
print("")
print(Core_Dataframe.groupby(by=['Employee_dept']).count())
Output:
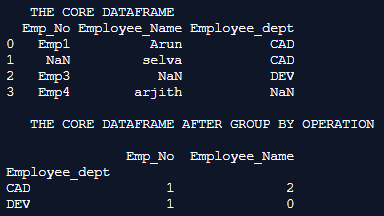
Explanation: In this example the core dataframe is first formulated. pd.dataframe() is used for formulating the dataframe. Every row of the dataframe is inserted along with their column names. Once the dataframe is completely formulated it is printed on to the console. We can notice at this instance the dataframe holds details like employee number, employee name, and employee department. The group by the method is then used to group the dataframe based on the Employee department column with count() as the aggregate method, we can notice from the printed output that the department grouped department along with the count of each department is printed on to the console.
Example #2
Code:
import pandas as pd
Core_Dataframe = pd.DataFrame( {
'name': ['Alan Xavier', 'Annabella', 'Janawong', 'Yistien', 'Robin sheperd', 'Amala paul', 'Nori'],
'city': ['california', 'Toronto', 'ontario', 'Shanghai',
'Manchester', 'california', 'ontario'],
'age': [51, 51, 23, 64, 31, 31, 47],
'py-score': [82.0, 73.0, 81.0, 30.0, 48.0, 61.0, 84.0] })
print("   THE CORE DATAFRAME ")
print(Core_Dataframe)
print("")
Output = Core_Dataframe.groupby(by=['city','age'])
print(Output.first())
Output:
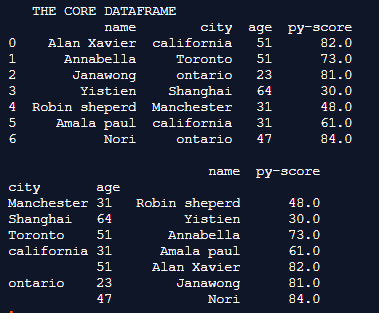
Explanation: In this example the core dataframe is first formulated. pd.dataframe() is used for formulating the dataframe. Every row of the dataframe is inserted along with their column names. Once the dataframe is completely formulated it is printed on to the console. We can notice at this instance the dataframe holds random people information and the py_score value of those people. the key columns used in this dataframe are name, age, city, and py-score value. Here two different columns are used for the grouping process, the city and age are those two columns. here no specific aggregate functionality is mentioned which means the grouping will be performed based on the values mentioned. we can notice the same on the printed output.
Example #3
Code:
import pandas as pd
Core_Dataframe = pd.DataFrame({'A' :  [ 1.23, 6.66, 11.55, 15.44, 21.44, 26.4 ],
'B' :  [ 2.345, 745.5, 12.4, 17.34, 22.35, 27.44 ],
'C' :  [ 3.67, 8, 13.4, 18, 23, 28.44 ],
'D' :  [ 4.6788, 923.3, 14.5, 19, 24, 29.44 ],
'E' :  [ 5.3, 10.344, 15.556, 20.6775, 25.4455, 30.3 ]})
print("   THE CORE DATAFRAME ")
print(Core_Dataframe)
print("")
print("   THE CORE DATAFRAME - GROUP BY COUNT ")
print(Core_Dataframe.groupby(by=['A,F'], axis=0,level=0).count())
print("")
print("   THE CORE DATAFRAME - GROUP BY MEAN ")
print(Core_Dataframe.groupby(by=['A,F'], axis=0,level=0).mean())
Output:
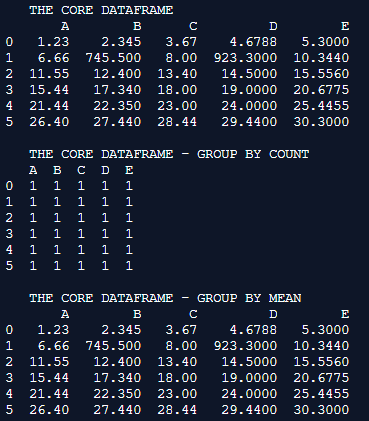
Explanation: In this example, the core dataframe is first formulated. pd.dataframe() is used for formulating the dataframe. Every row of the dataframe is inserted along with their column names. Once the dataframe is completely formulated it is printed on to the console. Here the groupby process is applied with the aggregate of count and mean, along with the axis and level parameters in place. The output is printed on to the console.
Recommended Articles
We hope that this EDUCBA information on “Pandas DataFrame.groupby()” was beneficial to you. You can view EDUCBA’s recommended articles for more information.


