Updated April 13, 2023

Introduction to Pandas pivot_table()
When data from a very large table needs to be summarised in a very sophisticated manner so that they can be easily understood then pivot tables is a prompt choice. The summarization can be upon a variety of statistical concepts like sums, averages, etc. for designing these pivot tables from a pandas perspective the pivot_table() method in pandas library can be used. This is an effective method for drafting these pivot tables in pandas.
Syntax:
pandas.pivot_table(data, values=None, index=None, columns=None, aggfunc='mean', fill_value=None, margins=False, dropna=True, margins_name='All', observed=False)Arguments :
| Parameter | Description |
| values | This is an optional argument which mentions the set of columns to be aggregated |
| data | Defines the data of the row |
| columns | The columns argument mentions the set of columns to be considered for the pivoting process. |
| index | The Index argument mentions the set of rows to be considered for the pivoting process. |
| aggfunc | When passing a set of functions as a list, There will be hierarchical columns where the top-level values are function names (These are mentioned from the object themselves) When passing a dict the major columns used to aggregate and value is the function. |
| fill_value | The replacement value for the missing values |
| margins | This is a boolean level argument that represents whether to add all rows and columns. |
| margins_name | When the margin value is true this mentions the name of the row or column that will hold the total |
| dropna | The dropna argument is used to exclude columns were Nan values are there |
| observed | When set to true it only shows observed values for the groupers categorical. |
Examples
Here are the following examples mention below
Example #1
Code:
import pandas as pd
import numpy as np
Core_Dataframe = pd.DataFrame({'Emp_No' : ['Emp1','Emp2','Emp3','Emp4'],
'Employee_Name' :  ['Arun', 'selva', 'rakesh', 'arjith'],
'Employee_dept' : ['CAD', 'CAD', 'DEV', 'CAD']})
print("   THE CORE DATAFRAME ")
print(Core_Dataframe)
print("")
table_Dataframe = Core_Dataframe.pivot_table(Core_Dataframe, index=[ 'Employee_dept', 'Emp_No'],columns=['Employee_dept'], aggfunc=np.sum)
print("   THE PIVOT TABLE DATAFRAME ")
print(table_Dataframe)
Output:
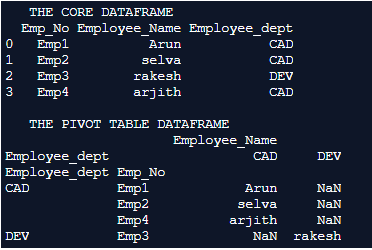
Explanation: In this example the core dataframe is first formulated. pd.dataframe() is used for formulating the dataframe. Every row of the dataframe is inserted along with their column names. Once the dataframe is completely formulated it is printed on to the console. We can notice at this instance the dataframe holds details like employee number, employee name, and employee department. The generated Pivot table is printed on to the console.
Example #2
Code:
import pandas as pd
import numpy as np
Core_Dataframe = pd.DataFrame({'A' :  [ 1, 6, 11, 15, 21, 26],
'B' :  [21, 71, 12, 17, 22, 27],
'C' :  [3, 8, 13, 18, 23, 28],
'D' :  [4, 9, 14, 19, 24, 29],
'E' :  [5, 10, 15, 20, 25, 30]})
print("   THE CORE DATAFRAME ")
print(Core_Dataframe)
print("")
table_Dataframe = Core_Dataframe.pivot_table(Core_Dataframe, index=[ 'A', 'B'],columns=['C'], aggfunc=np.sum)
print("   THE PIVOT TABLE DATAFRAME ")
print(table_Dataframe)
Output:
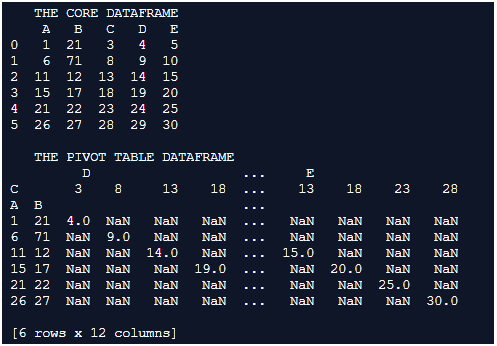
Explanation: In this example the core dataframe is first formulated. pd.dataframe() is used for formulating the dataframe. Every row of the dataframe is inserted along with their column names. Once the dataframe is completely formulated it is printed on to the console. We can notice at this instance the dataframe holds a random set of numbers and alphabetic values of columns associated with it. The generated dataframe is printed onto the console.
Example #3
Code:
import pandas as pd
import numpy as np
Core_Dataframe = pd.DataFrame( {
'name': ['Alan Xavier', 'Annabella', 'Janawong', 'Yistien', 'Robin sheperd', 'Amala paul', 'Nori'],
'city': ['california', 'Toronto', 'Osaka', 'Shanghai',
'Manchester', 'california', 'Osaka'],
'age': [51, 38, 23, 63, 18, 51, 63],
'py-score': [82.0, 73.0, 81.0, 30.0, 48.0, 61.0, 84.0] })
print("   THE CORE DATAFRAME ")
print(Core_Dataframe)
print("")
table_Dataframe = Core_Dataframe.pivot_table(Core_Dataframe, index=[ 'city'  ],columns=['name' , 'py-score'], aggfunc=np.sum)
print("   THE PIVOT TABLE DATAFRAME ")
print(table_Dataframe)
Output:
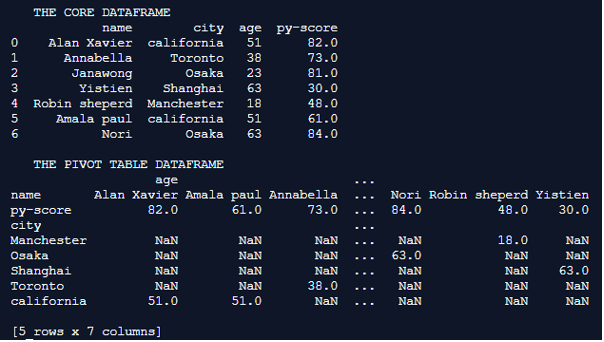
Explanation: In this example the core dataframe is first formulated. pd.dataframe() is used for formulating the dataframe. Every row of the dataframe is inserted along with their column names. Once the dataframe is completely formulated it is printed on to the console. We can notice at this instance the dataframe holds random people information and the py_score value of those people. the key columns used in this dataframe are name, age, city, and py-score value. The iterrows() function offers the flexibility to sophisticatedly iterate through these rows of the dataframe. The generated pivot table is printed onto the console.
Example #4
Code:
import pandas as pd
import numpy as np
import pandas as pd
Core_Dataframe = pd.DataFrame({'Column1' :  [ 'A', 'B', 'C', 'D', 'E', 'F'],
'Column2' :  [ 'G', 'H', 'I', 'J', 'K', 'L'],
'Column3' :  [ 'M', 'N', 'O', 'P', 'Q', 'R'],
'Column4' :  [ 'S', 'T', 'U', 'V', 'W', 'X'],
'Column5' :  [ 'Y', 'Z', None, None, None, None]})
print("   THE CORE DATAFRAME ")
print(Core_Dataframe)
print("")
table_Dataframe = Core_Dataframe.pivot_table(Core_Dataframe, index=[ 'Column5'  ],columns=['Column1' ], aggfunc=np.sum)
print("   THE PIVOT TABLE DATAFRAME ")
print(table_Dataframe)
Output:
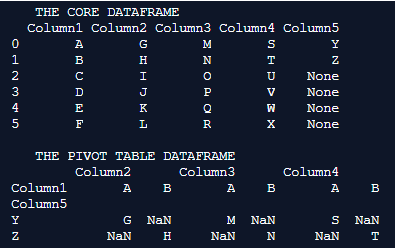
Explanation: In this example the core dataframe is first formulated. pd.dataframe() is used for formulating the dataframe. Every row of the dataframe is inserted along with their column names. Once the dataframe is completely formulated it is printed on to the console. We can notice in this example the dataframe is associated with values of alphabets in the English dictionary. Every column in the dictionary is tagged with suitable column names. The generated pivot table is printed onto the console.
Example #5
Code:
import pandas as pd
import numpy as np
import pandas as pd
Core_Dataframe = pd.DataFrame({'A' :  [ 3.67, 6.66, 14.5, 13.4, 21.44, 10.344],
'B' :  [ 2.345, 745.5, 12.4, 13.4, 22.35, 10.344 ],
'C' :  [ 3.67, 8, 13.4, 18, 23, 28.44 ],
'D' :  [ 4.6788, 923.3, 14.5, 19, 24, 29.44 ],
'E' :  [ 5.3, 10.344, 15.556, 13.45, 10.344, 30.3 ]})
print("   THE CORE DATAFRAME ")
print(Core_Dataframe)
print("")
table_Dataframe = Core_Dataframe.pivot_table(Core_Dataframe, index=[ 'A'  ],columns=['B' , 'C' ], aggfunc=np.sum)
print("   THE PIVOT TABLE DATAFRAME ")
print(table_Dataframe)
Output:
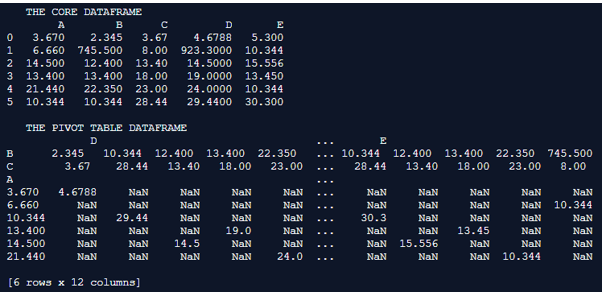
Explanation: In this example the core dataframe is first formulated. pd.dataframe() is used for formulating the dataframe. Every row of the dataframe is inserted along with their column names. Once the dataframe is completely formulated it is printed on to the console. A typical float dataset is used in this instance. The generated pivot table is printed onto the console.
Recommended Articles
We hope that this EDUCBA information on “Pandas pivot_table()” was beneficial to you. You can view EDUCBA’s recommended articles for more information.
