Updated April 14, 2023

Introduction to Pandas shift()
Pandas shift() which is also termed as Pandas Dataframe.shift() function shifts the list by wanted number of periods with a discretionary time frequency. This capacity takes a scalar parameter called period, which speaks to the quantity of movements to be made over the ideal pivot. This capacity is useful when managing time series information.
Syntax and Parameters:
Dataframe.shift(periods=0,frequency=none,axis=0)Where,
- periods represents the axis shift function to be implemented and it can be positive or negative.
- frequency represents the multiple parameters such as data offset, timedelta, time series modules and time rule string.
- axis represents 0 to represent rows and 1 to represent columns.
How Pandas shift() Function works?
Given below shows how Pandas shift() function works through various examples:
Example #1
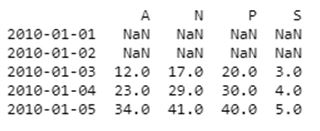
Using Pandas Dataframe shift() function to shift the row axis by 2 periods in the positive direction.
Code:
import pandas as pd
ind = pd.date_range('1 / 1 / 2010', periods = 5, frequency ='12H')
df = pd.DataFrame({"S":[3, 4, 5, 6, 7],
"P":[20, 30, 40, 50, 60],
"A":[12, 23, 34, 45, 56],
"N":[17, 29, 41, 53, 8]},
index = ind)
df.shift(2, axis = 0)
print(df.shift(2, axis = 0))
Output:
Explanation:
- In the above program, we first import pandas as pd and then we create a dataframe with row and column values. Later we initialize the date, month, and year and initialize the time period and frequency of the axis. We have taken the time frequency as 12 hours in interval and we are generating 5 index values in continuous periods.
- Now we make use of the shift() function to shift the axis to 2 periods in the positive axis and thus axis is assigned to 0 by default of using this command. Thus, the code considers the shift() function to move the axis by 2 periods and hence produces the above output.
Example #2
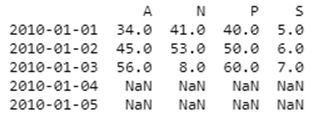
Using shift() function to shift the row axis of the dataframe by 2 periods in the negative direction.
Code:
import pandas as pd
ind = pd.date_range('1 / 1 / 2010', periods = 5, frequency ='12H')
df = pd.DataFrame({"S":[3, 4, 5, 6, 7],
"P":[20, 30, 40, 50, 60],
"A":[12, 23, 34, 45, 56],
"N":[17, 29, 41, 53, 8]},
index = ind)
df.shift(-2, axis = 0)
print(df.shift(-2, axis = 0))
Output:
Explanation:
- In the above program, similar to the previous program, we import the pandas function as pd and define the rows in the dataframe and assign it to a variable named df. Now, similar to the previous program we consider the 12 hours time interval and set this time to the frequency. Generating the 5 index values in the dataframe makes the code more clear and we assign it to the periods variable parameter and thus stating that the date has to be generated for 5 times in the period of 12 hours.
- After this step, the next step is to assign the index to our dataframe and term it ind. Now in this program, we use the shift() function to move the shift axis to 2 periods on the negative direction of the x axis and the axis is set to 0 by default and hence the output is generated as shown above.
Example #3
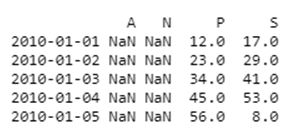
Using shift() function in Pandas dataframe to shift the column axis to the positive direction.
Code:
import pandas as pd
ind = pd.date_range('1 / 1 / 2010', periods = 5, frequency ='12H')
df = pd.DataFrame({"S":[3, 4, 5, 6, 7],
"P":[20, 30, 40, 50, 60],
"A":[12, 23, 34, 45, 56],
"N":[17, 29, 41, 53, 8]},
index = ind)
df.shift(2, axis = 1)
print(df.shift(2, axis = 1))
Output:
Explanation:
- In the above program, we first import pandas as pd and then define the dataframe and instead of row index values you will define all the column index values. Then we define the time frequency as 12 hours interval and define it to the parameter frequency. Along with time frequency, we also define 5 index values and assign it to the period parameter so that the date and time is generated in periods of 5 in a time frequency of 12 hours.
- Now we define the index values and assign it to a parameter ind. Now in the shift() operation, we command the code to shift 2 periods in the positive direction in the column axis and thus in the output the first 2 columns are generated as NaN because we shift the axis in the positive direction.
Example #4
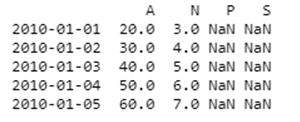
Using shift() function in Pandas dataframe to shift the column axis to the negative direction.
Code:
import pandas as pd
ind = pd.date_range('1 / 1 / 2010', periods = 5, frequency ='12H')
df = pd.DataFrame({"S":[3, 4, 5, 6, 7],
"P":[20, 30, 40, 50, 60],
"A":[12, 23, 34, 45, 56],
"N":[17, 29, 41, 53, 8]},
index = ind)
df.shift(-2, axis = 1)
print(df.shift(-2, axis = 1))
Output:
Explanation:
- In the above program, we first import pandas as pd and afterward characterize the dataframe and rather than rowindex esteems, you will characterize all the columnindex esteems. At that point we characterize the time recurrence as 12 hours stretch and characterize it to the parameter time frequency. Alongside time frequency, we likewise characterize 5 record esteems and appoint it to the period parameter with the goal that the date and time is produced in times of 5 of every period recurrence of 12 hours.
- Presently we characterize the index esteems and appoint it to a parameter ind. Presently in the shift() activity, we order the code to shift 2 periods the negative way in the column hub and in this way in the yield the last 2 columns are produced as NaN since we move the pivot the negative way.
Conclusion
Thus, we saw that in Pandas Dataframe shift() function, we shift the axis of rows and columns of the particular dataframe in positive and negative directions. It very important to note that assigning and defining the time frequency and the number of periods is very crucial when we want to implement this function.
Recommended Articles
We hope that this EDUCBA information on “Pandas shift()” was beneficial to you. You can view EDUCBA’s recommended articles for more information.


