Updated April 3, 2023

Introduction to Pandas Statistics
Pandas Statistics incorporates an enormous number of strategies all in all register elucidating measurements and other related procedures on dataframe. The majority of these are accumulations like total(), mean(), yet some of them, as sumsum(), produce an object of a similar size. As a rule, these techniques take a pivot contention, much the same as ndarray, yet the name or whole number can determine the hub.
Syntax and Parameters
statistics= dataframe.describe(Value)where,
describe is used to define the specific row or column of the dataframe.
Value is the value assigned to the statistics on whichever operation has to be performed in that particular row or column.
How to perform statistics in Pandas?
Now we see various examples of how these statistics are performed in different ways in Pandas.
Example #1
To perform Pandas statistics only on the ‘Amount’ column
Code:
from pandas import DataFrame
Vehicles = {'Company': ['Mercedes E','Honda City','Corolla Altis','Corolla Altis','BMW X'],
'Amount': [15000,16000,17000,18000,20000],
'Year': [2010,2011,2012,2013,2014]
}
df = DataFrame(Vehicles, columns= ['Company', 'Amount','Year'])
statistics_numeric = df['Amount'].describe()
print (statistics_numeric)
Output:
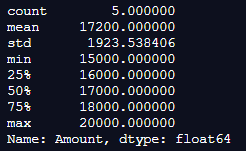
In the above program, we first import pandas, and then we import the dataframe from pandas. After importing the dataframe, we define the dataframe by assigning values to it. Now, we use the Pandas statistics function to describe the amount of each vehicle and give all the possible basic statistics for each vehicle. Finally, the program is implemented, and the result is as shown in the above snapshot.
Example #2
Adding astype(int) to get the integer values of Pandas statistics.
Code:
from pandas import DataFrame
Vehicles = {'Company': ['Mercedes E','Honda City','Corolla Altis','Corolla Altis','BMW X'],
'Amount': [15000,16000,17000,18000,20000],
'Year': [2010,2011,2012,2013,2014]
}
df = DataFrame(Vehicles, columns= ['Company', 'Amount','Year'])
statistics_numeric = df['Amount'].describe().astype (int)
print (statistics_numeric)
Output:
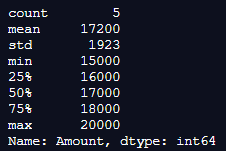
Here, it is similar to the previous program except that we removed all the decimal values in the program. Instead, we produced the amount as integer values for the same column using statistics and described function.
Example #3
Including all the three categories in the Statistics
Code:
from pandas import DataFrame
Vehicles = {'Company': ['Mercedes E','Honda City','Corolla Altis','Corolla Altis','BMW X'],
'Amount': [15000,16000,17000,18000,20000],
'Year': [2010,2011,2012,2013,2014]
}
df = DataFrame(Vehicles, columns= ['Company', 'Amount','Year'])
statistics=df.describe(include='all')
print (statistics)
Output:
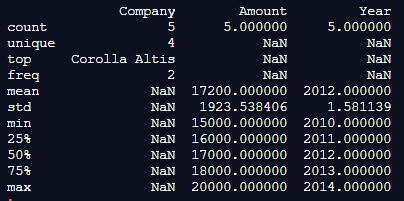
In the above program, when you do not categorize data and include all the rows and columns of the dataframe, the program produces an output consisting of everything, as shown in the above snapshot. Hence, Pandas statistics can be used to figure out the different standards of descriptive statistics.
Example #4
Using different categorical data to produce statistics.
Code:
from pandas import DataFrame
Vehicles = {'Company': ['Mercedes E','Honda City','Corolla Altis','Corolla Altis','BMW X'],
'Amount': [15000,16000,17000,18000,20000],
'Year': [2010,2011,2012,2013,2014]
}
df = DataFrame(Vehicles, columns= ['Company', 'Amount','Year'])
statistics = df['Company'].describe()
print(statistics)
Output:
In the above program, we first import the dataframe from pandas as usual and then define this dataframe and assign values to it. After that, we use the panda’s statistics to describe a different category of the dataframe, which is the company of the vehicle. So, the program is executed, and it shows the unique companies of vehicles, and it is implemented, and finally, the statistics are as shown in the above snapshot.
This capacity gives the mean, sexually transmitted disease, and IQR values. What is more, the work rejects the character segments and given a rundown about numeric sections. ‘incorporate’ is the contention that is utilized to pass fundamental data with respect to what sections should be considered for summing up. Next, takes the rundown of qualities; of course, ‘number’.
The object summarizes the String sections. The number summarizes Numeric sections and all Summarizes all sections together. This capacity gives you a few valuable things all simultaneously. For instance, you will get the three quartiles, mean, check, least, and most extreme qualities and the standard deviation. This is exceptionally valuable, particularly in exploratory information examination.
You can likewise pick explicit percentiles to be remembered for the portray strategy yield by including the percentiles contention and indicating. You can change the number of percentiles you request; however you see fit 4 percentiles are only a model. In the event that your article is non-mathematical, the synopsis measurements will be slightly unique. They will incorporate the tally, recurrence, quantity of kind qualities, and top worth. On the off chance that your article contains both mathematical and non-mathematical qualities, the portray strategy will just incorporate rundown insights into the mathematical qualities.
Conclusion
Hence I would like to conclude by stating that capacities like total(), cumsum() work with both numeric and character (or) string information components with no blunder. Despite the fact that is in practice, character totals are never utilized, by and large, these capacities do not toss any exemption. Also, capacities like abs(), cumprod() toss special cases when the Dataframe contains character or string information in light of the fact that such activities can’t be performed.
Recommended Articles
We hope that this EDUCBA information on “Pandas Statistics” was beneficial to you. You can view EDUCBA’s recommended articles for more information.


