Updated July 24, 2023
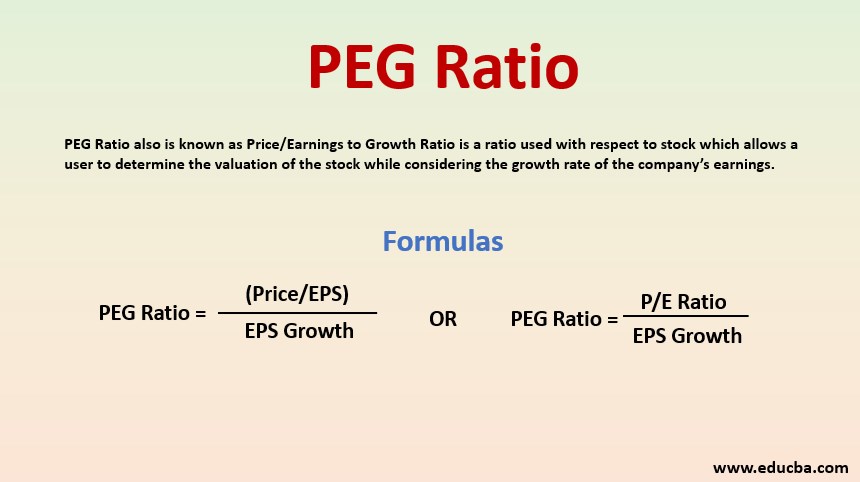
Definition of PEG Ratio
PEG Ratio, also known as Price/Earnings to Growth Ratio, is a ratio used with respect to stock that allows a user to determine the stock’s valuation while considering the growth rate of the company’s earnings.
This can be calculated by using the following formula.
i.e.
Thus, in order to calculate PEG Ratio, Price Earnings Ratio is divided by EPS Growth, wherein Price Earnings Ratio is calculated by dividing the price of the share by earnings per share.
Examples of PEG Ratio (With Excel Template)
Let’s take an example to understand the calculation in a better manner.
Example #1
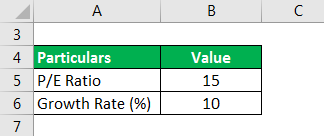
A share is having a P/E Ratio of 15 and the estimated growth in earnings of the company in the coming year is expected to be at the rate of 10%. Let us calculate the PEG Ratio in this case.
Solution:
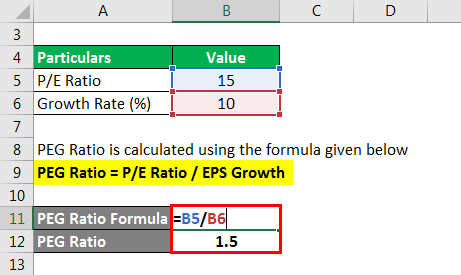
PEG Ratio is calculated using the formula given below
PEG Ratio = P/E Ratio / EPS Growth
PEG Ratio = 15 / 10%
= 1.5
Thus, in this case, comes to be 1.5
Example #2
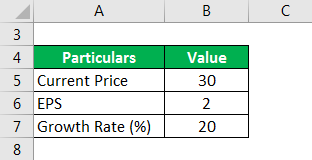
A share is currently trading at $30 and the EPS of the share is $2. The earnings of the company are expected to grow by 20%.
Solution:
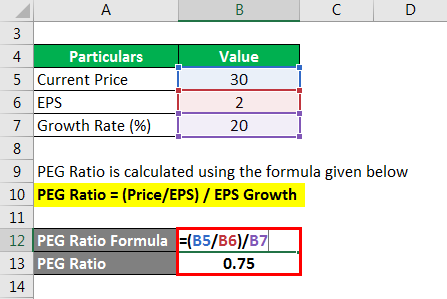
PEG Ratio is calculated using the formula given below
PEG Ratio = (Price/EPS) / EPS Growth
PEG Ratio = (30/2) /20
= 0.75
Thus, in this case, it comes to be 0.75.
PEG Ratio vs P/E Ratio
- P/E Ratio or the Price Earnings Ratio of a stock is arrived at by diving the current price of the stock by its earning per share. The result so derived indicates the amount that the investors are ready to pay to earn one dollar of the company’s earnings. It can reveal whether a stock is undervalued or overvalued. A stock having a higher P/E Ratio is said to be overvalued considering the earnings expected to be derived in the future from the stock. On the other hand, a lower P/E Ratio will reflect that the stock is undervalued considering the expected earnings.
- However, the P/E ratio does not take into effect the rate of growth at which the earnings of the company are expected to increase in the future. This is taken into effect in the case. It indicates whether a stock is overvalued or undervalued after taking into effect the growth factor. Thus, it provides a better understanding of the stock valuation.
Advantages and Disadvantages
Below are the points that explain the advantages and disadvantages:
Advantages
- It helps the investors to compare the stocks of companies that have different levels of growth rates.
- It provides a better understanding of a stock’s valuation as compared to the P/E ratio since it also considers the rate at which the earnings of the company are expected to grow.
Disadvantages
- The ratio is not an appropriate factor for evaluating companies with fewer growth rates. The reason is that even though the companies provide fewer opportunities for growth, but they may be providing a good amount of dividend income to its investors.
- The calculation of the ratio involves usage of estimated growth rate. Since the ratio is based on estimations, it is subjected to the possibility of major deviations from the actual results.
- The ratio does not take into account the growth rate of the economy as a whole, and it is for this reason that an investor must compare the PEG of the company’s stock with the PEG across the industry in which the company operates.
Conclusion
An ideal for a stock is one. It means that when any stock has it as one, the current price of the stock is said to be consistent with its estimated earnings, which in turn means that the stock is priced at par. When the ratio is greater than one, it indicates that the stock is overvalued as the growth expectations are very much high. On the other hand, if the ratio is less than one, it would mean that the stock is undervalued as the growth expectations are very less.
Recommended Articles
This is a guide to the PEG Ratio. Here we discuss how to calculate along with practical examples. We also provide a downloadable excel template. You may also look at the following articles to learn more –
