What is the Phillips Curve in Economics?
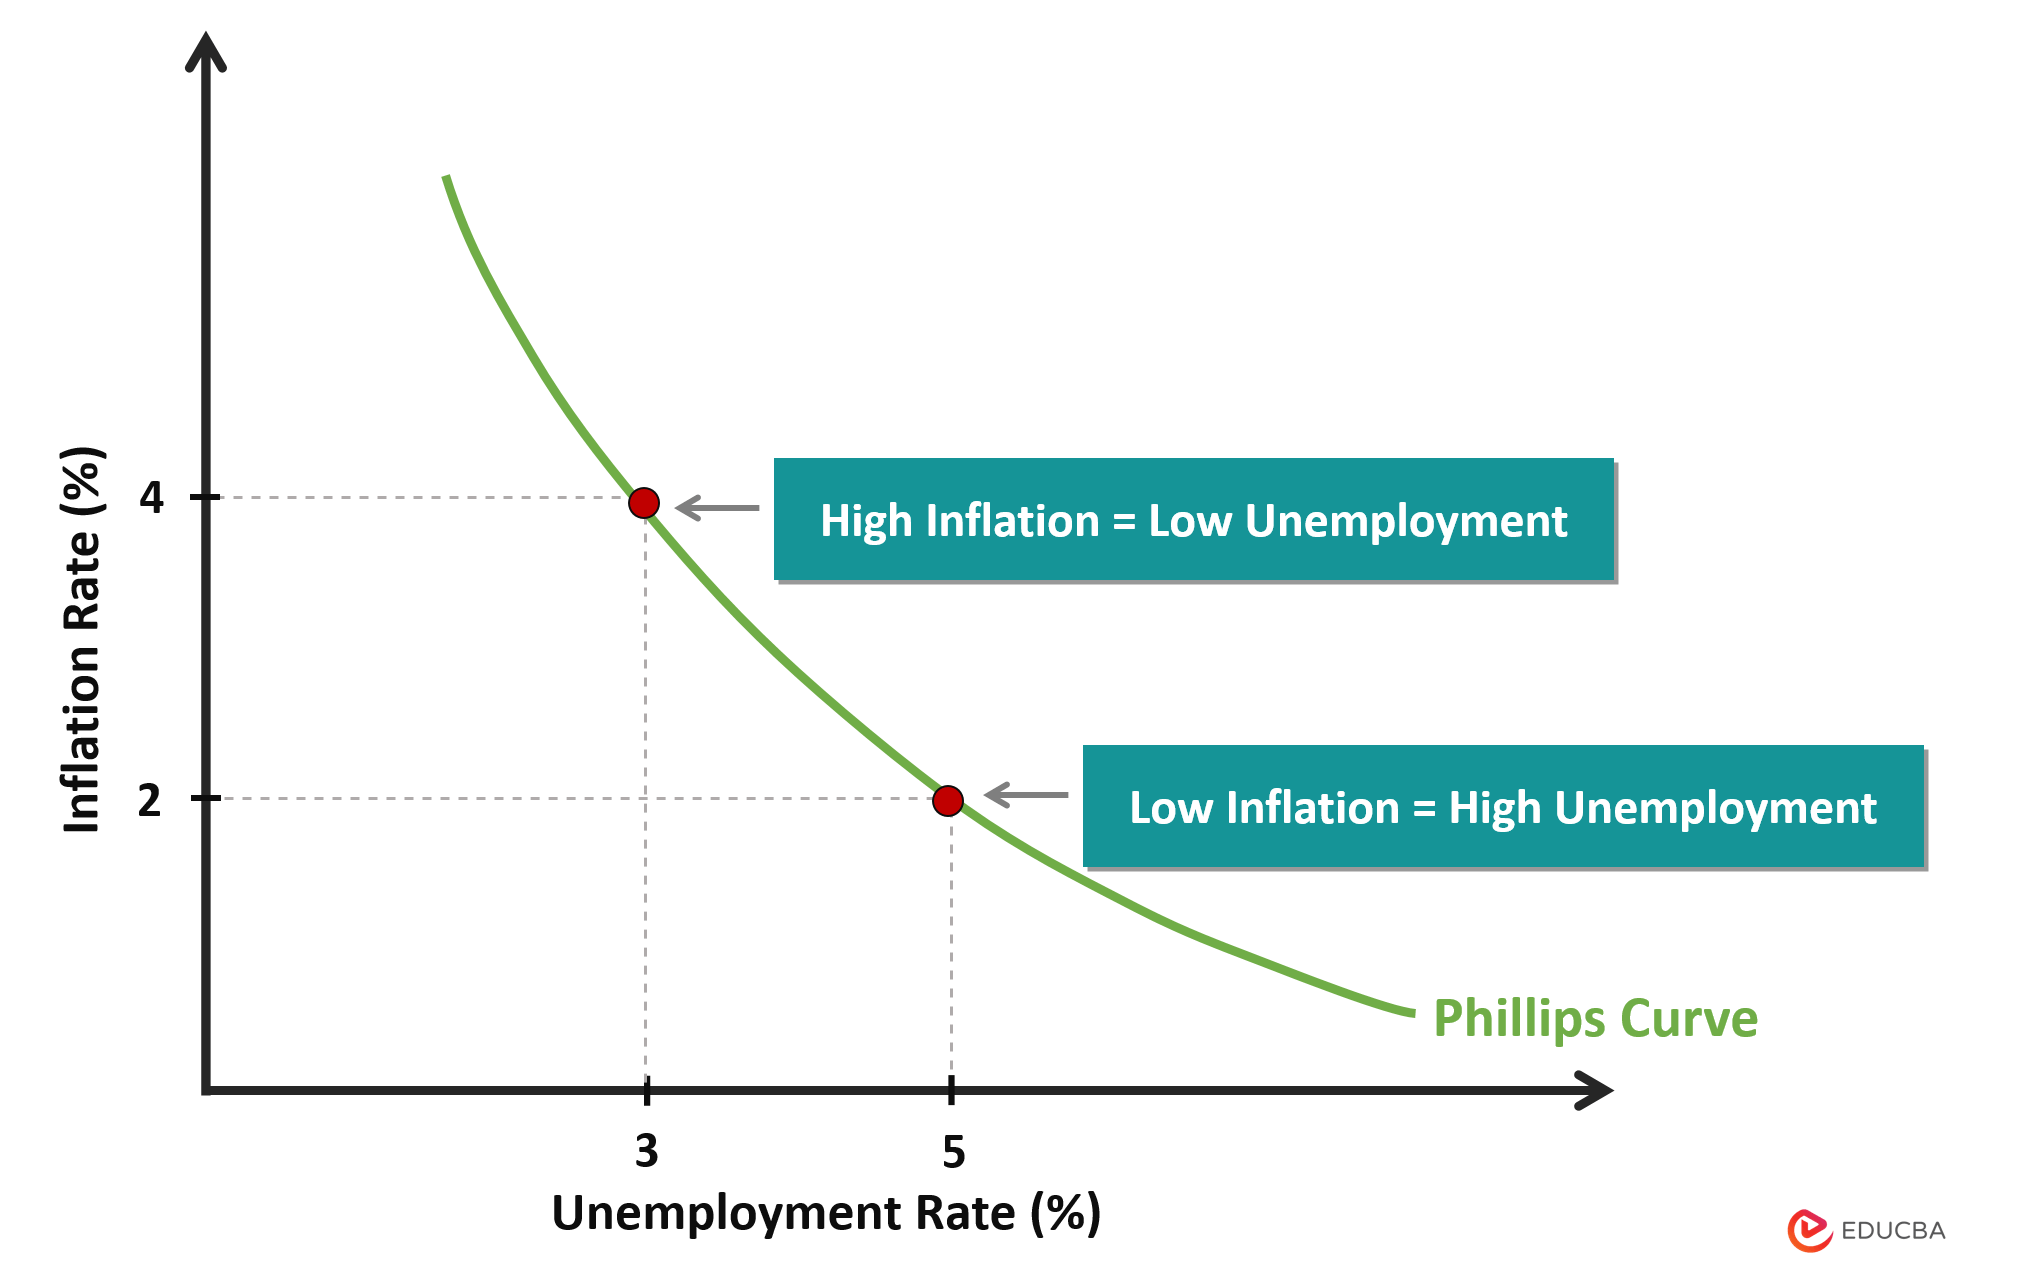
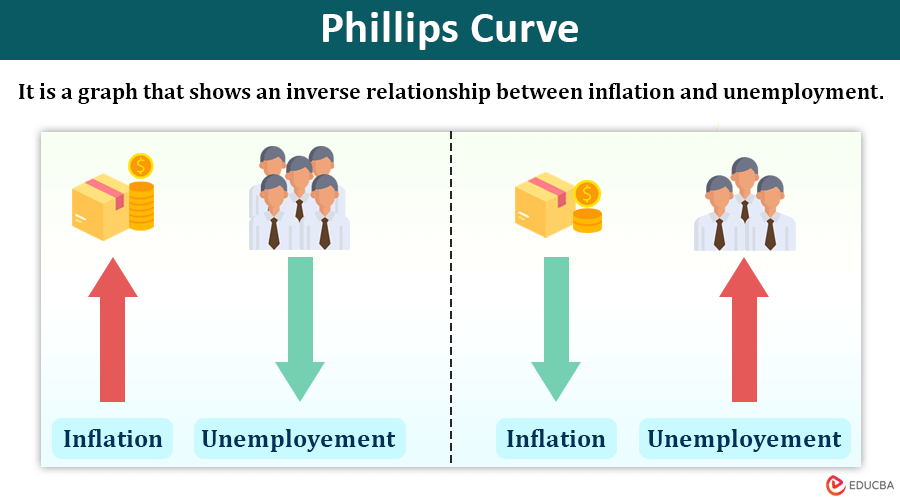
Phillips curve, developed by economist Alban William Phillips, is an economic theoretical graph that explains how unemployment and inflation are inversely correlated.
He observed that when unemployment decreases, inflation increases, and when inflation decreases, unemployment increases. Similarly, other economists also found similar patterns like the Phillips curve model. Also, he published his findings in an article, “The Relationship between Unemployment and the Rate of Change of Money Wages in the United Kingdom, 1861-1957,” in the British Academic Journal, Economica.
In addition, central banks and policymakers have then applied these principles to set monetary policy during that period to balance inflation and unemployment. They adjusted interest rates or money supply to maintain stable economic conditions. However, in the 1970s, there was stagnation, where the unemployment and inflation rates were high; this caused a breakdown in the reliability of this curve in predicting economic outcomes.
Table of Contents
- What is it?
- Graph Explained
- Inflation and Phillips Curve
- Short-Run Phillips Curve
- Long-Run Phillips Curve
- Advantages
- Disadvantages
Phillips Curve Graph Explained
Between 1861 and 1957, William Phillips studied how prices went up (inflation) and how many people worked (unemployment rates) in the United Kingdom. Then, he plotted the data on the graph: inflation on the Y-axis and unemployment rate on the X-axis. This data plotted appeared like a downward-sloping curve, showing an inverse relationship between them.
The following are suggestions that he mentions in this graphical study:
1. Low Unemployment → High Inflation
- When unemployment is low, there are very few employees who do not have jobs, so employers may have trouble finding workers. So, to attract and retain employees, they offer higher wages or salaries.
- This increase in wages will lead to higher production costs and product prices for businesses, thus causing high inflation.
2. High Unemployment → Low Inflation
- When unemployment is high, companies don’t have to pay much to get workers because there are plenty of available workers.
- This situation might lead to lower wage growth or even decreased wages.
- As a result, businesses might lower their product prices to attract more customers, leading to low inflation or even deflation.
Correlation Between Types of Inflation and Phillips Curve
Let us understand in depth the concepts of inflation and the Phillips curve.
1. Demand-Pull Inflation
- Demand-pull inflation arises when the aggregate demand for products in an economy increases more than its aggregate supply.
- In the short run, businesses cannot produce enough products to meet the market demand, so the aggregate supply remains constant. Here, as the quantity of supply cannot balance the quantity of demand, businesses will increase the price of their product, leading to high inflation.
2. Cost-Push Inflation
- On the other hand, cost-push inflation arises when increased raw costs, production costs, or supply chain disruptions lead to higher product prices. This high production will decrease the aggregate supply while aggregate demand remains constant.
- In this situation, businesses will increase their product prices to continue making profits and maintain their profit margin, leading to high inflation.
Short-Run and Long-Run Phillips Curve
Let’s understand the two types of this curve, short-run and long-run Phillips curves, with examples.
A) Short-Run Phillips Curve (SRPC)
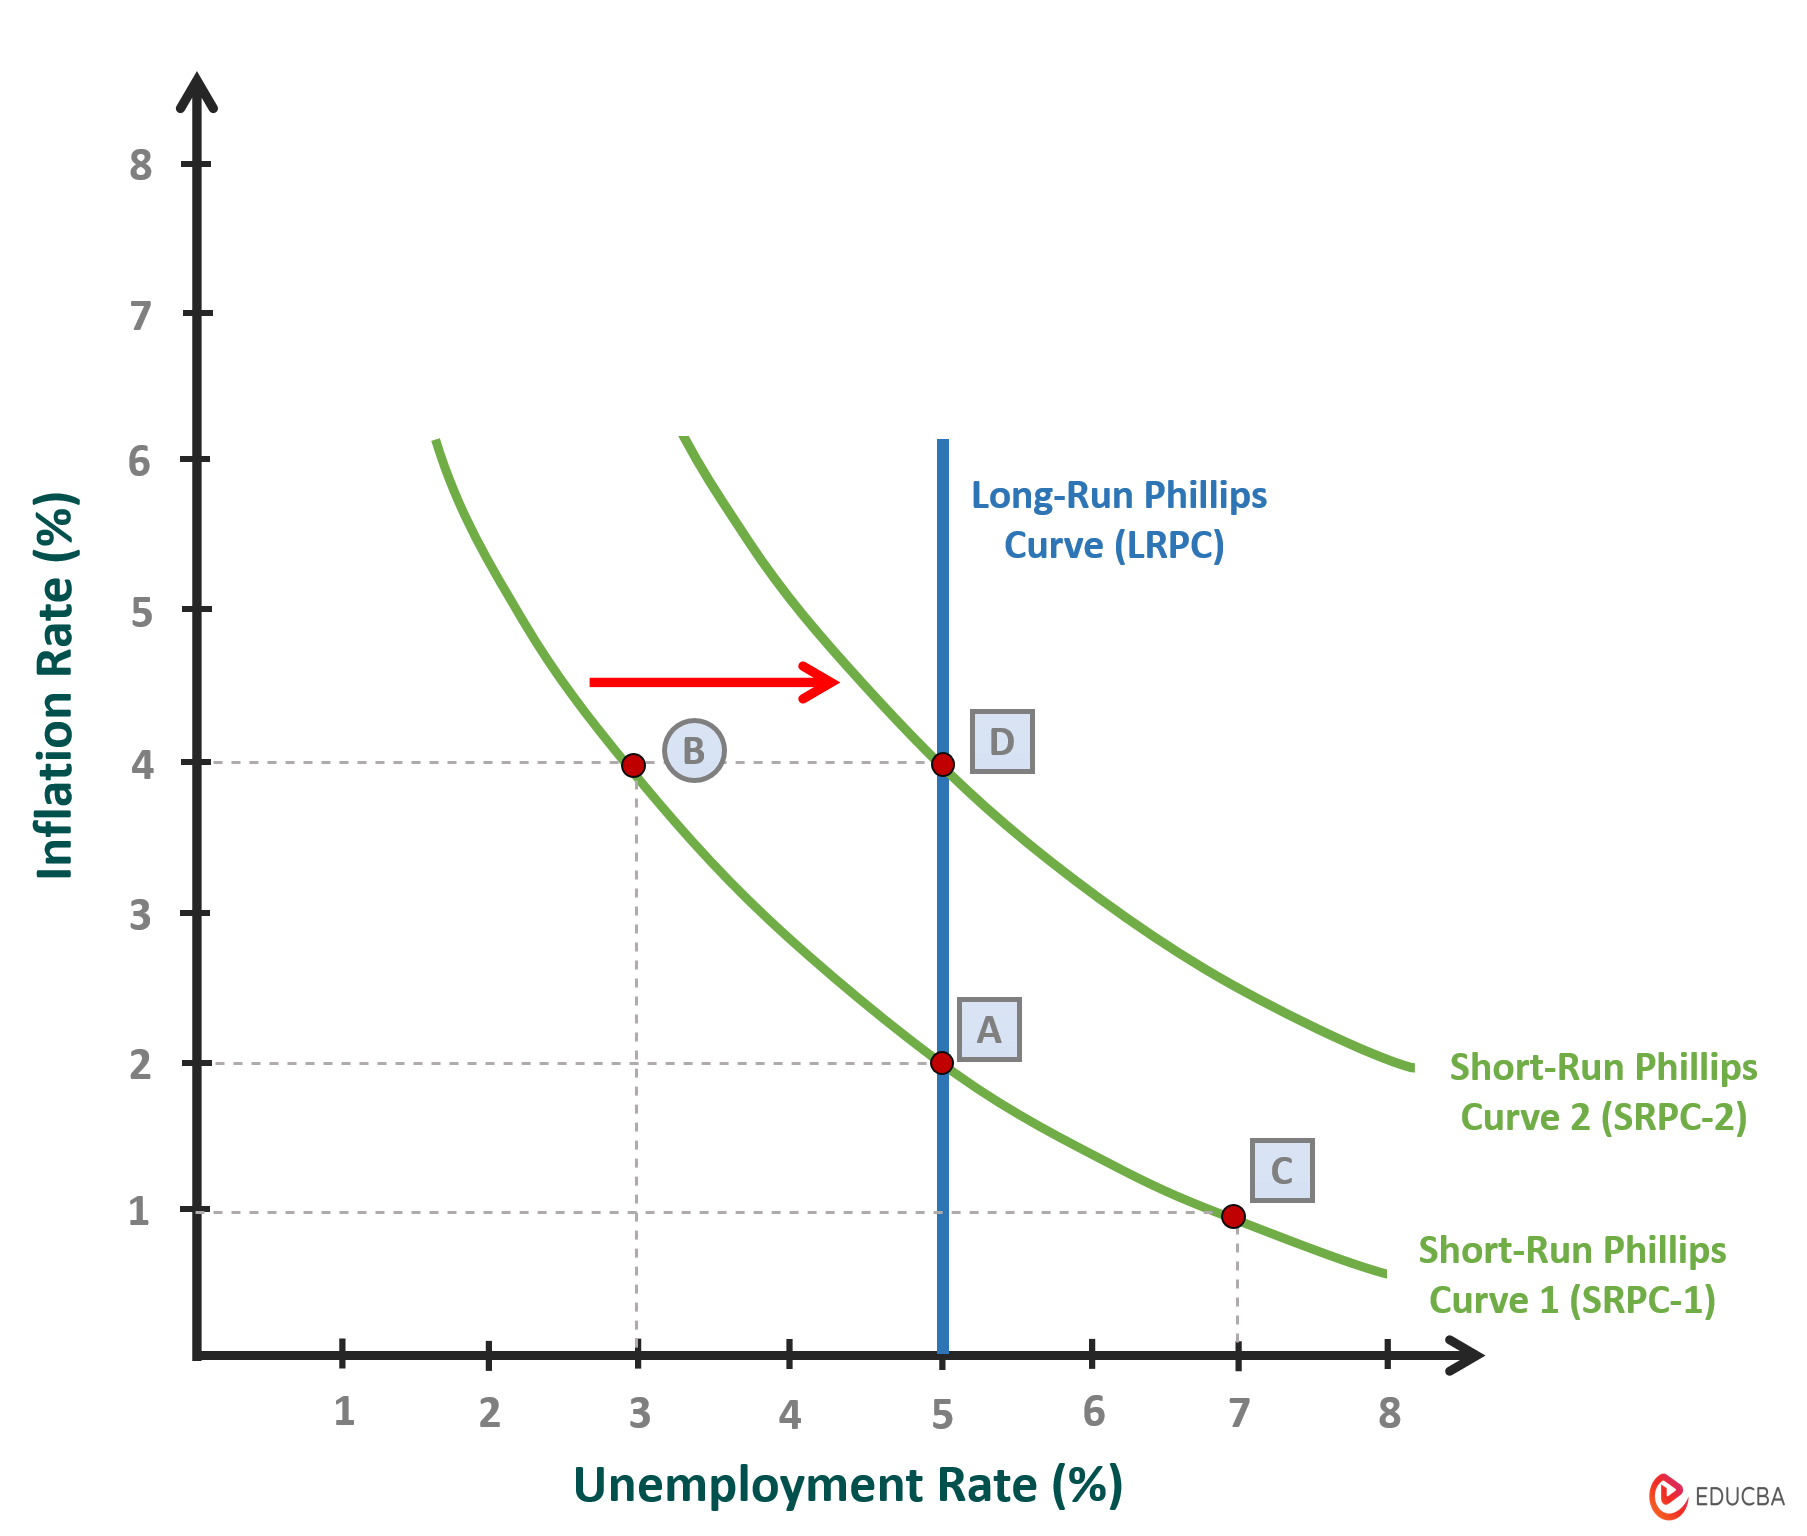
It is a downward-sloping curve showing the inverse relationship between the employment rate and inflation. This relationship is for a short duration. This curve shows two shifts. So, let’s understand what shifts this curve.
#1: Upward and Leftward Movement
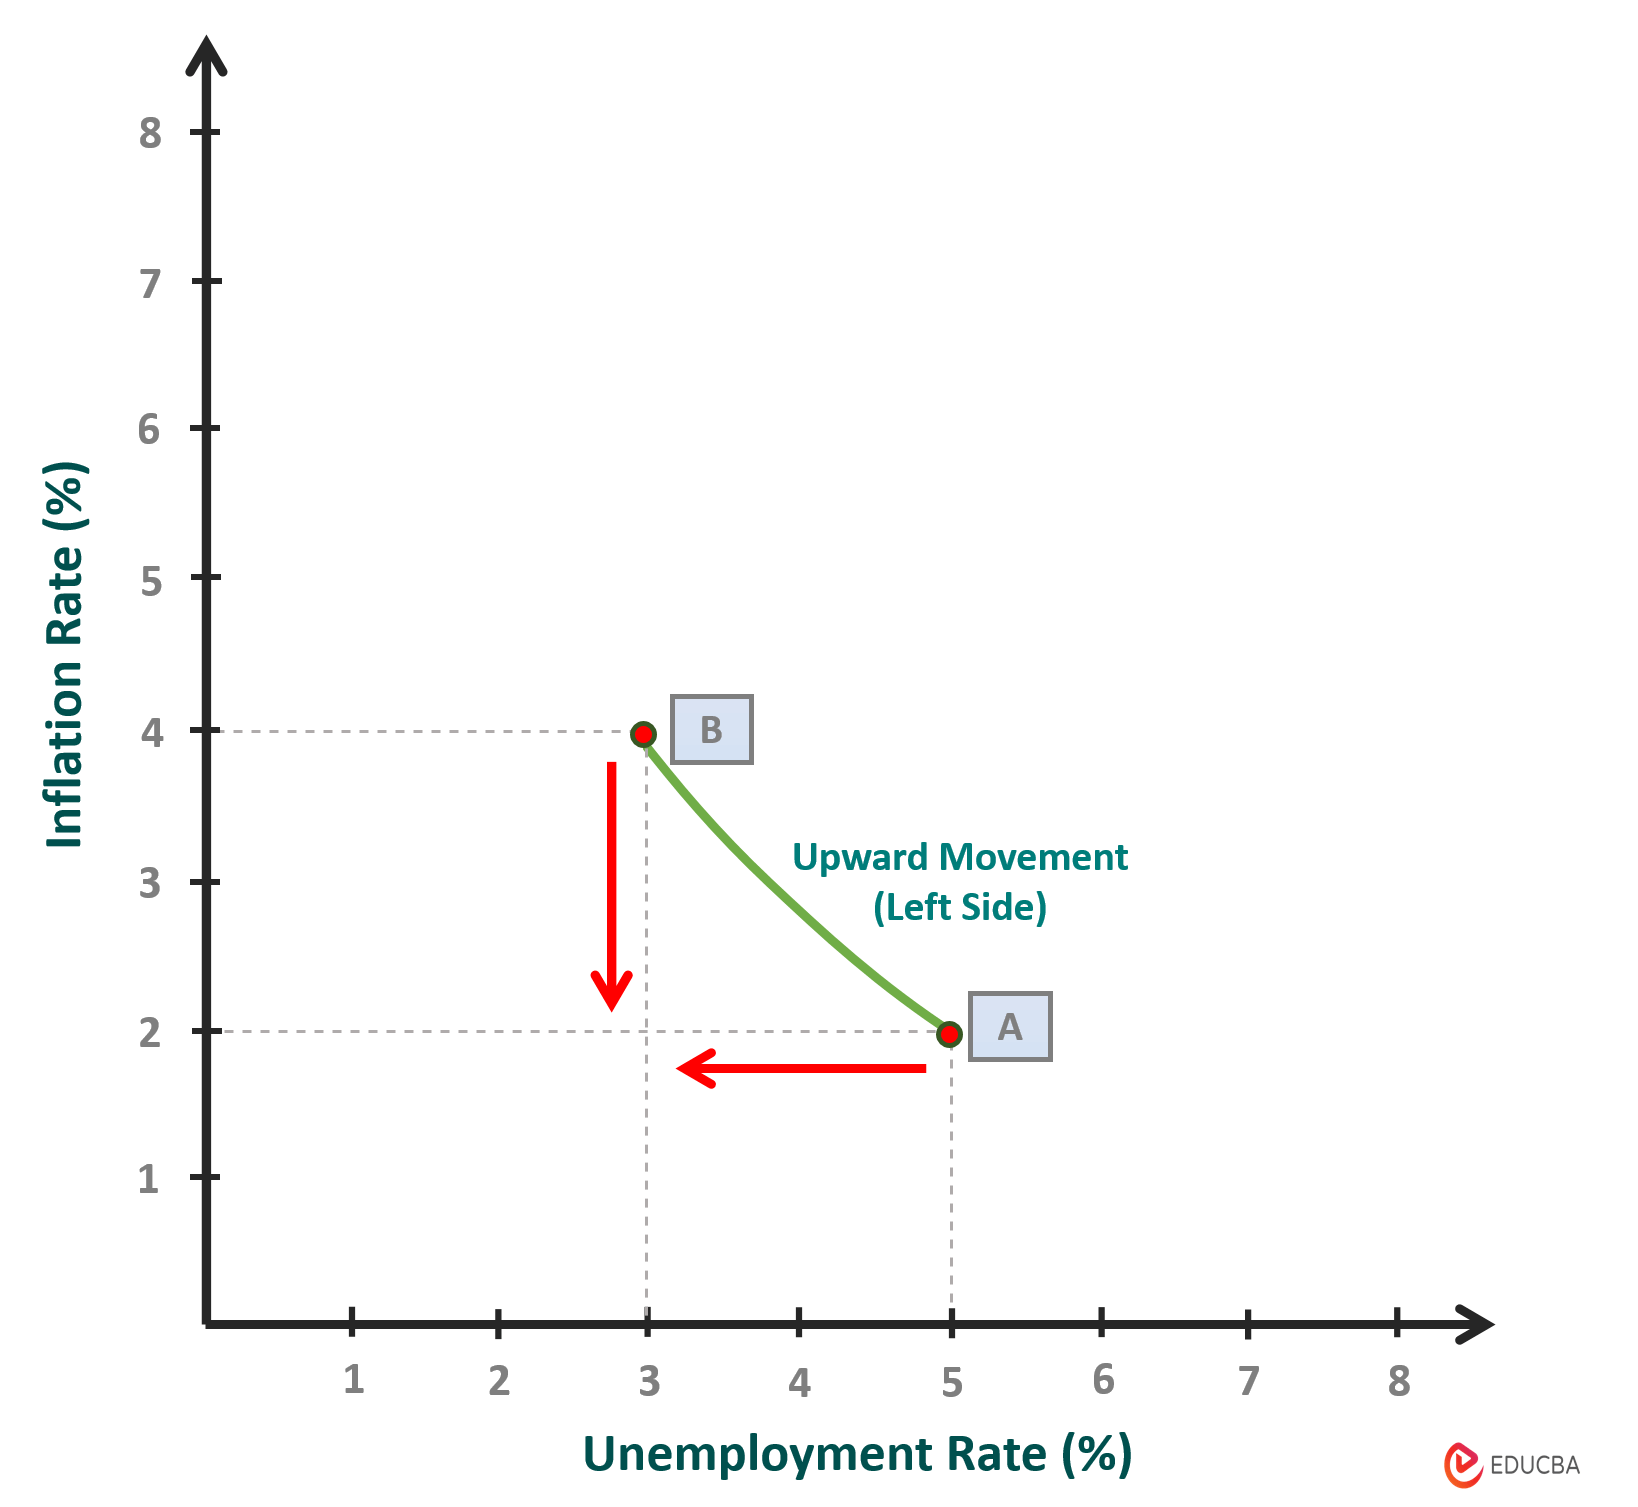
When inflation rises, the points on the Y-axis (inflation) will move upwards on the graph. Meanwhile, the points on the X-axis (unemployment rate) shift left. Therefore, the curve will move upward and left.
Suppose the inflation rate is 2% in Country XY, and the initial or natural unemployment rate is 5% (A). Now, let’s consider there is a sudden increase in aggregate demand due to a government stimulus package. Businesses hire more workers to meet the product demand, reducing the employment rate to 3%. But it also increases customer spending, increasing the inflation rate to 4% (B).
#2: Downward and Rightward Movement
Conversely, when inflation decreases, the points on the Y-axis (inflation) will move downwards, and the points on the X-axis ((unemployment rate) shift right. Therefore, the curve will go downward and right.
Now, a sudden global economic downturn affects Country XY’s economy and reduces customers’ spending capacity. It decreases the product’s aggregate demand and reduces the inflation rate to 1%. As a result, businesses may lay off workers or hire fewer workers, leading to a high unemployment rate of 7% (C).
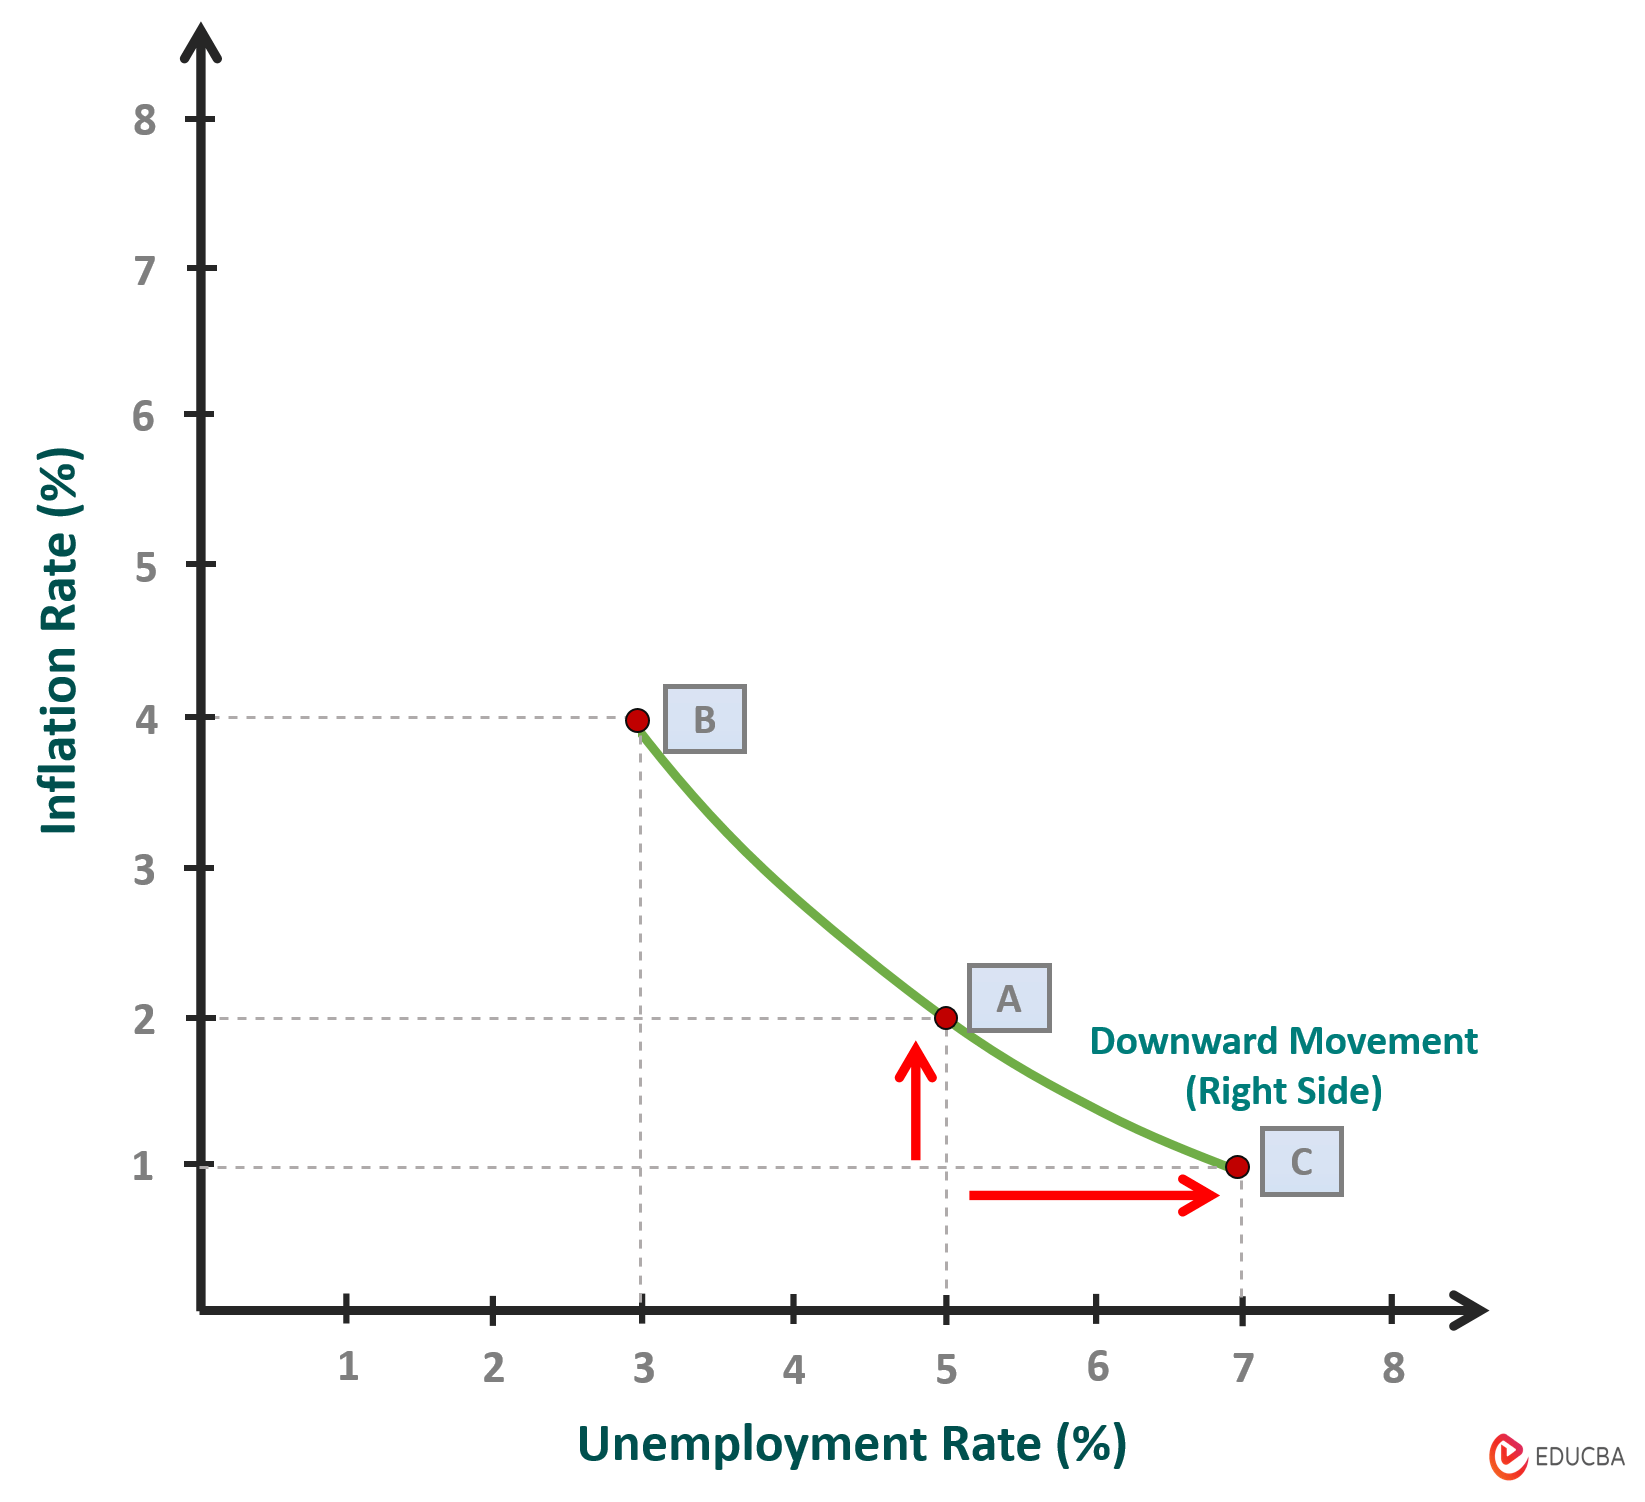
The movement along the short-run Phillips curve occurs due to changes in aggregate demand.
B) Long-Run Phillips Curve (LRPC)
It is a vertical-line graph that shows the relationship between inflation and unemployment when the economy is at full employment. There is no trade-off, i.e., inflation will not affect the unemployment rate in the long run.
Here, the economy will adjust so that the unemployment rate returns to the equilibrium rate, i.e., the non-accelerating inflation rate of unemployment (NAIRU), also known as the natural rate of unemployment.
According to economists, when the unemployment rate of Country XY decreases from 5% to 3% due to high inflation, the country’s economy will be unstable. Here, the unemployment rate on the Phillips curve, in the long run, will return to its natural unemployment rate of 5% (D).
Here, the initial graph, “Short-Run Phillips Curve-1” (SRPC-1), will shift rightward, and a new SRPC-2 curve will form, but inflation will remain higher. Therefore, the “Long-Run Phillips Curve” (LRPC) is a vertical line because unemployment will return to its natural rate irrespective of inflation or price level.
Advantages
The following are the advantages of the curve.
1. Knowledge of trade-off
The curve helps us understand the trade-off relationship between inflation and unemployment and how they are interconnected. It also helps to understand how workers and businesses interrelate during inflation.
2. Helps in policy implications
It provides insights to the government for making monetary and fiscal policy decisions, such as interest rates, money supply, and government spending.
3. Maintains economic stability
Policymakers can use this concept to make decisions to balance these two factors to obtain optimal equilibrium and economic stability.
Disadvantages
1. Does not consider global changes
Sometimes, external factors may impact a country’s economic conditions. This curve only considers domestic market data and does not consider the effects of international inflation or any event.
2. Not reliable in the long run
It is only applicable in the short-run, and in the long-run, there is no trade-off, meaning it cannot explain the relationship between unemployment and inflation.
3. May differ from the actual prediction
Economic factors, such as workers and businesses, can change and adapt their wages and policies based on past experiences. So, the actual impact of the policy will differ from what this curve predicts.
4. Assumes stability in long-run
This curve assumes a stable relationship between inflation and unemployment over time. However, numerous variables can change and influence economic conditions, affecting the prediction of the correct outcome.
Final Thoughts
To conclude, this curve is a crucial tool for government policy that aims to lower the economy’s unemployment rate while considering inflation. Policymakers should also consider additional factors and models to make informed economic decisions.
Recommended Articles
We hope this article on the Phillips curve was informative. To learn more about related topics, refer to the articles below.
