Introduction to Prerequisites for Machine Learning
In the realm of cutting-edge technology, machine learning stands at the forefront, revolutionizing industries and transforming the way we interact with the world. From personalized recommendations to autonomous vehicles, machine learning empowers computers to learn from vast amounts of data and make intelligent decisions. If you’ve ever been captivated by the idea of building intelligent systems, understanding the prerequisites for machine learning is your essential first step.
Embarking on a journey into machine learning requires a solid foundation in several key areas. As with any endeavor, building upon a sturdy groundwork paves the way for success. Let us unveil the prerequisites that will equip you with the skills to unravel the mysteries of machine learning and harness its potential to shape the future.
Table of Content
What are the Prerequisites for Machine Learning?
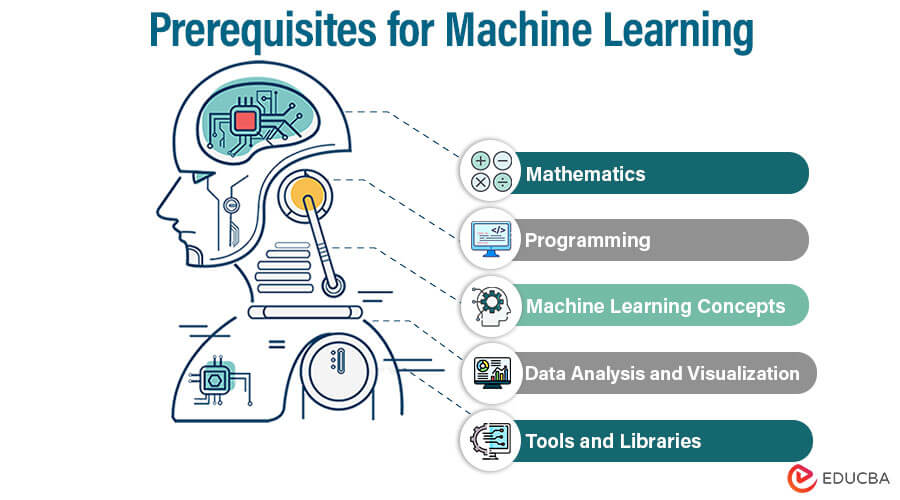
Here are some of the key prerequisites for getting started with machine learning:
Mathematics
Having a solid grasp of mathematics is crucial when it comes to machine learning. You should have a good grasp of calculus, linear algebra, and probability theory. These mathematical concepts form the basis of many machine-learning algorithms and techniques.
1. Linear Algebra
Linear algebra is a fundamental mathematical tool for representing and manipulating data and performing transformations and computations.
Here are some key concepts related to linear algebra in the context of machine learning:
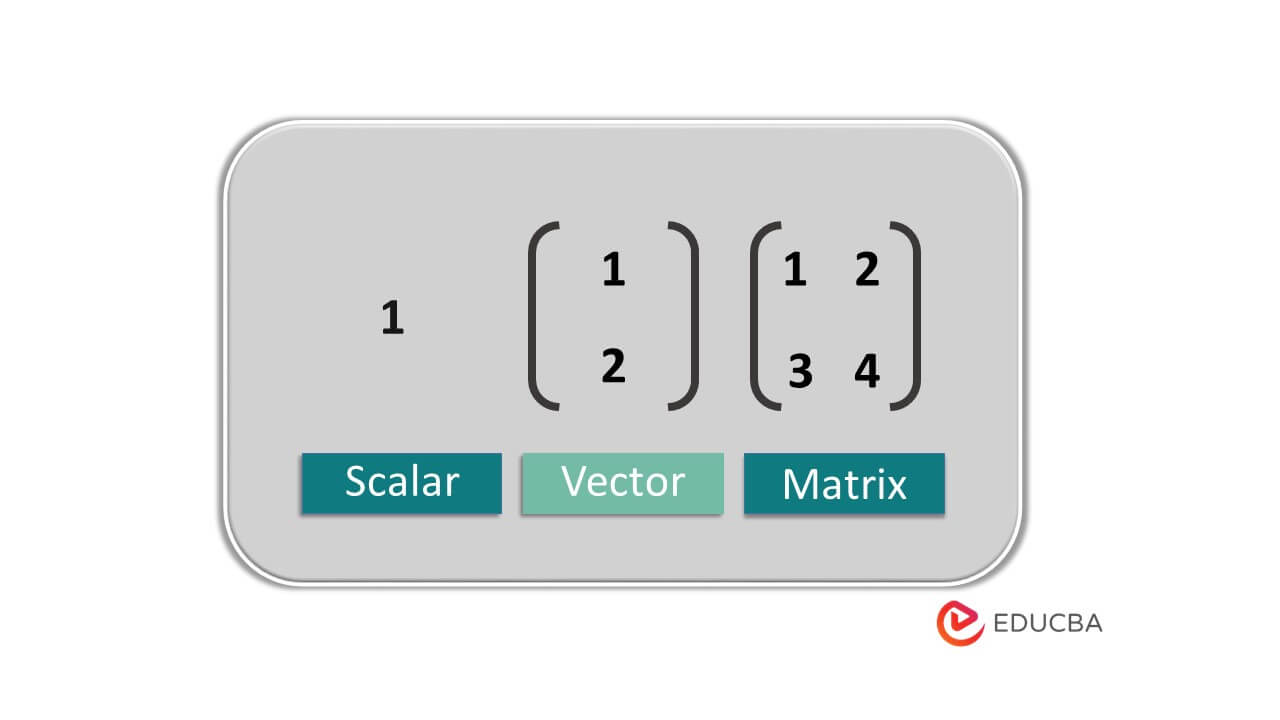
Vectors and Matrices
Vectors are essential mathematical objects that represent values with both magnitude and direction. Machine learning frequently uses vectors to represent features or data points. A vector can be represented as a row or column matrix. They serve as representations of datasets or transformation processes.
Operations on Vectors and Matrices
Several operations can be performed on vectors and matrices in machine learning. These include addition and subtraction, which are done element-wise. Scalar multiplication involves multiplying each element of a vector or matrix by a scalar value. The Numpy library is used to do operations on vectors. Vectors are an array of numbers.
import numpy as np
X=np.array([[1,2],[2,6]])
Y=np.array([[2,2],[3,4]])
print(X)print(Y)#Additon of matrix
print(np.add(X,Y))#Substraction of matrix
print(np.subtract(X,Y))Matrix Transformations
Matrixes are frequently used in machine learning to represent transformation operations.
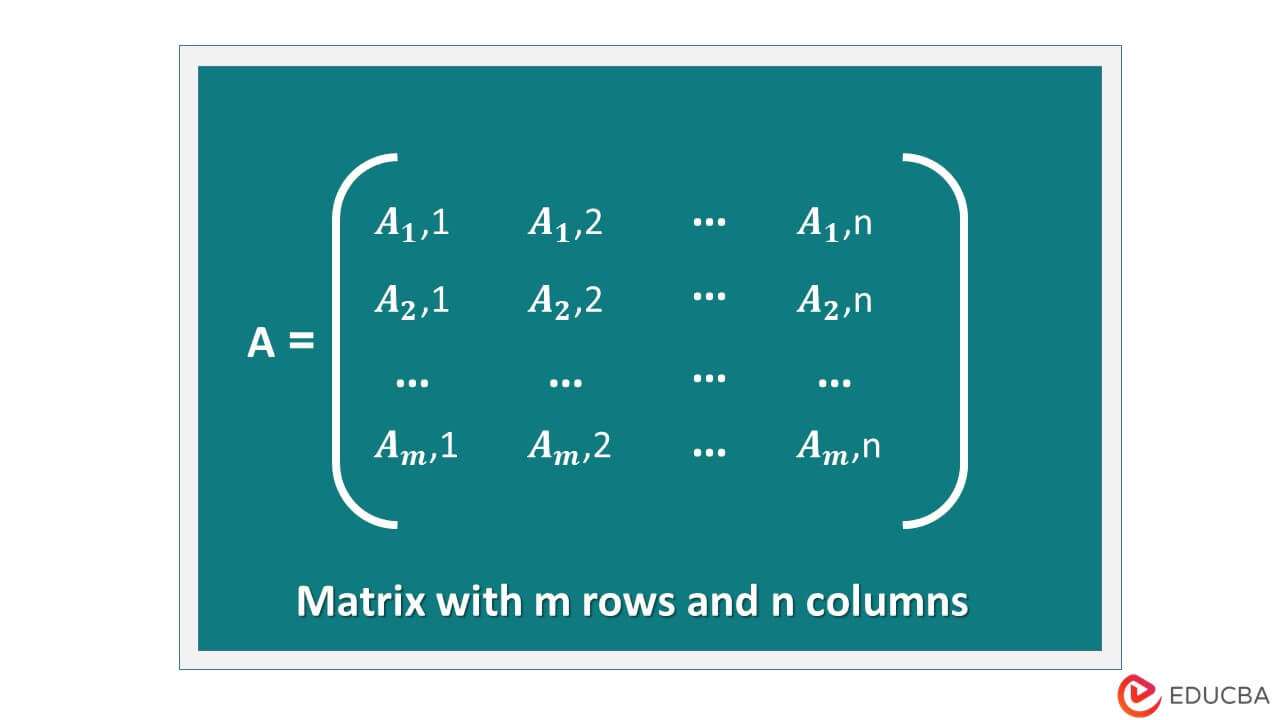
A matrix is a 2-D array of shapes [m*n].
Common types of transformations include translation, scaling, rotation, and sharing. These transformations can modify the properties of vectors or matrices when applied to them.
We can create an array using numpy. First, you need to install Numpy and then import it.
import numpy as npYou need to use the array() method to create an array.
x = np.array([1,2,3,4])Also, you can create a 2D array as
x = np.array([[1,2],[3,4],[4,5]])2. Calculus
Calculus is essential to machine learning, especially for optimizing and comprehending function behavior. The following are the central calculus concepts pertinent to machine learning:
Differential Calculus (Derivatives): Differential calculus deals with the concept of derivatives, which measure the rate of change of a function at a particular point. In machine learning, derivatives are extensively used for optimization. The gradient of a function represents the direction of the steepest ascent or descent, and it helps find the minimum or maximum points of a function. In Python, differential calculus is done using the SymPy library.
You need to install it first.
# Importing libraries
import sympy as sym
# Declaring variables
x, y, z = sym.symbols('x y z')
# expression of which we have to find derivative
exp = x**5* y + y**4 + z
derivative1_x = sym.diff(exp, x)
print('derivative w.r.t. x: ', derivative1_x)
derivative1_y = sym.diff(exp, y)
print('derivative w.r.t.y: ', derivative1_y)
Integral Calculus (Integrals): Integral calculus involves the concept of integrals, which compute the accumulated change of a function over an interval.
Optimization Techniques: Optimization is fundamental to machine learning, and calculus provides the tools to optimize functions. Optimization techniques aim to find the values of model parameters that minimize (or maximize) a specific objective function.
3. Probability and Statistics
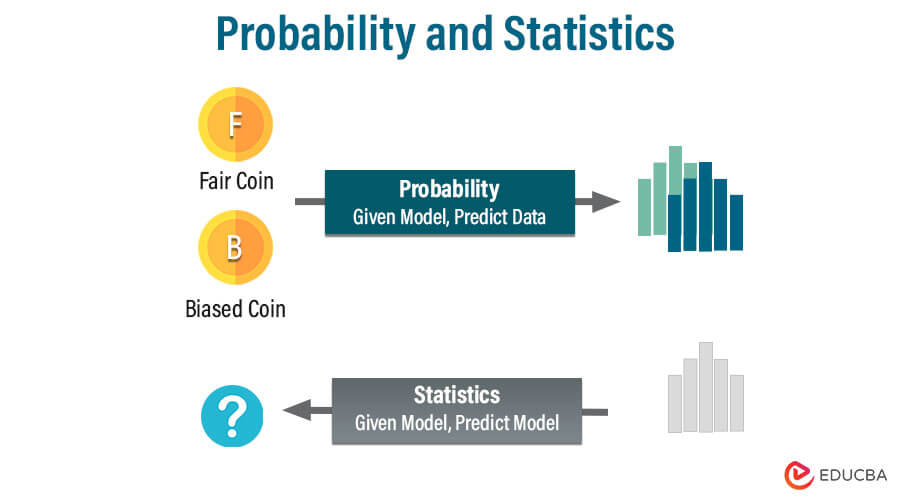
Statistics and probability are essential components of machine learning. They offer the mathematical foundation to deal with uncertainty, make predictions, and draw inferences from data. The main ideas in probability and statistics about machine learning are as follows:
- Probability Theory: Probability theory deals with quantifying uncertainty. It provides a mathematical framework to model and analyze random events and their likelihoods. In machine learning, understanding probability theory is crucial for modeling uncertainty, estimating probabilities, and making probabilistic predictions.
- Random Variables and Distributions: Chance determines the values of random variables. We use random variables in machine learning to represent data and model outcomes.
- Descriptive Statistics: Summarizing and describing a dataset’s key features is a task of descriptive statistics. Data’s central tendency, distribution, and form are understood using mean, variance, and standard deviation metrics. In addition to aiding in preprocessing and exploratory data analysis, descriptive statistics offer insights into the data.
- Statistical Inference: Statistical inference entails drawing inferences or forecasts about a population based on a sample of data. The importance of differences or correlations found is evaluated using the widely used statistical inference approach known as hypothesis testing in machine learning. Confidence intervals give a range estimate for where a population parameter is most likely to fall.
Programming
Working with machine learning requires a fundamental understanding of programming. You can use it to apply algorithms, work with data, and create models. There are several popular programming languages for machine learning, each with advantages and potential uses. Several important programming languages for machine learning are listed below
1. Programming Languages
- Python is widely used in machine learning with libraries such as NumPy, Pandas, and Sci-kit-learn.
The machine learning industry frequently utilizes Python due to its readability, simplicity, and extensive ecosystem of libraries and frameworks.
It offers strong libraries like NumPy (for numerical computation), Pandas (for data analysis and manipulation), and Scikit-Learn (for machine learning tools and techniques). Python also supports libraries for deep learning, like PyTorch and TensorFlow. Python is popular for new and seasoned practitioners due to its simplicity and robust environment.
- R language is commonly used for statistical computing and data analysis.
The computer language R was created primarily for statistical computation and data analysis. It offers extensive libraries and packages for data manipulation and machine learning, including Caret, randomForest, and glmnet.
Academics and the statistical community favor R because of its vast statistical features and visualization tools. It is frequently applied to statistical modeling, data exploration, and carrying out verifiable research.
- Some machine learning frameworks use Java, C++, or other languages.
Although Python and R are frequently the top languages of choice for machine learning, other languages like Java and C++ are widely utilized, notably in some machine learning frameworks and applications. While C++ is frequently used to create high-performance, efficient machine-learning models, Java offers tools like Deep Learning and Weka. These languages are recommended when low-level control, quickness, and system integration are essential.
The choice of programming language in machine learning depends on factors such as the task at hand, personal preference, the existing codebase or infrastructure, and community support. Python’s versatility, ease of use, and extensive libraries make it a popular choice for beginners and rapid prototyping.
Noting that learning multiple programming languages can be beneficial, as it broadens your skill set and enables you to leverage the strengths of different languages in various machine-learning projects.
2. Data Manipulation
Data manipulation is a critical aspect of machine learning, involving tasks such as data loading, cleaning, preprocessing, and transformation. Here are some key points related to data manipulation in the context of machine learning:
- Reading and writing data from different file formats (CSV, JSON, etc.)
Machine learning often involves working with data stored in various file formats, such as CSV (Comma-Separated Values), JSON (JavaScript Object Notation), Excel spreadsheets, and databases. Python and other programming languages provide libraries and functions to read and write data from different file formats, making working with diverse data sources easy.
- Data Cleaning and Preprocessing
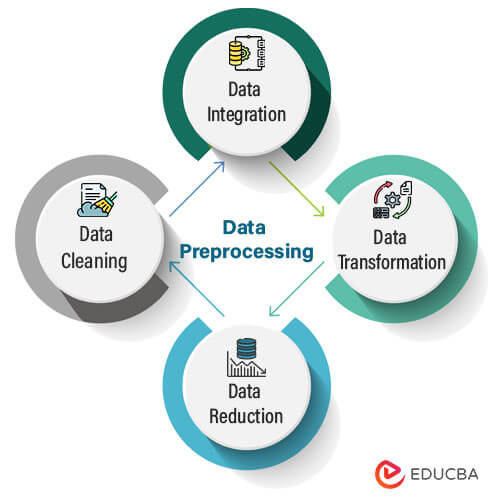
Raw data often contains errors, missing values, outliers, and inconsistencies that can negatively impact the performance of machine learning models. Data cleaning involves identifying and correcting these issues to ensure data quality.
Preprocessing refers to the process of converting data into a format that is appropriate for use with machine learning algorithms. Common data preprocessing techniques include handling missing values, feature scaling, one-hot encoding for categorical variables, and feature engineering.
- Working with data structures (lists, arrays, and dictionaries)
Data structures like lists, arrays, and dictionaries are essential for organizing and manipulating data. Lists and arrays hold data sequences, while dictionaries allow you to create key-value pairs for more complex data structures.
Python’s built-in data structures and libraries, like NumPy, offer powerful tools for handling data efficiently.
- Familiarity with relevant libraries (NumPy, Pandas) for data manipulation
NumPy and Pandas are two widely used Python libraries for data manipulation. NumPy supports multi-dimensional arrays and mathematical functions, making it ideal for numerical computations and data manipulation.
Pandas offers data structures like Series and DataFrame for handling labeled and structured data. It also provides numerous functions for data cleaning, preprocessing, and analysis. These libraries significantly streamline the data manipulation process in machine learning.
Machine Learning Concepts
1. Supervised Learning
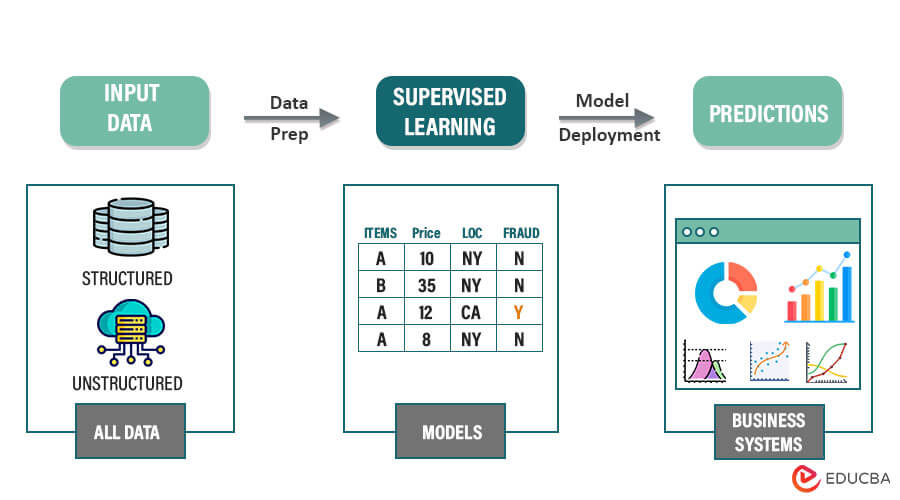
Supervised learning involves using labeled data to make predictions or classify new, unseen data in machine learning. It involves two main tasks: regression and classification. Here are some key algorithms associated with supervised learning:
Regression
1. Linear Regression: Linear regression is a venerable statistical technique that unveils the hidden connections between variables, unraveling insights and paving the way for predictive power. It assumes a linear relationship between the dependent and independent variables.
2. Polynomial Regression: Polynomial regression is an extension of linear regression that allows for fitting polynomial functions to the data.
By including polynomial terms in the linear regression model, nonlinear interactions between variables can be captured.
Difference
| Aspect | Linear Regression | Polynomial Regression |
| Function type | Linear function: y=mx+b | Polynomial function:y=a0+a1x+a2x^2+… |
| Complexity | A simple Model with fewer parameters | A more complex model with additional parameters |
| Performance | Suitable for modeling linear relationships | Can better capture non-linear patterns |
| Example Equation | y=mx+b | y=a0+a1x+a2x^2+a3x^3+…. |
Classification
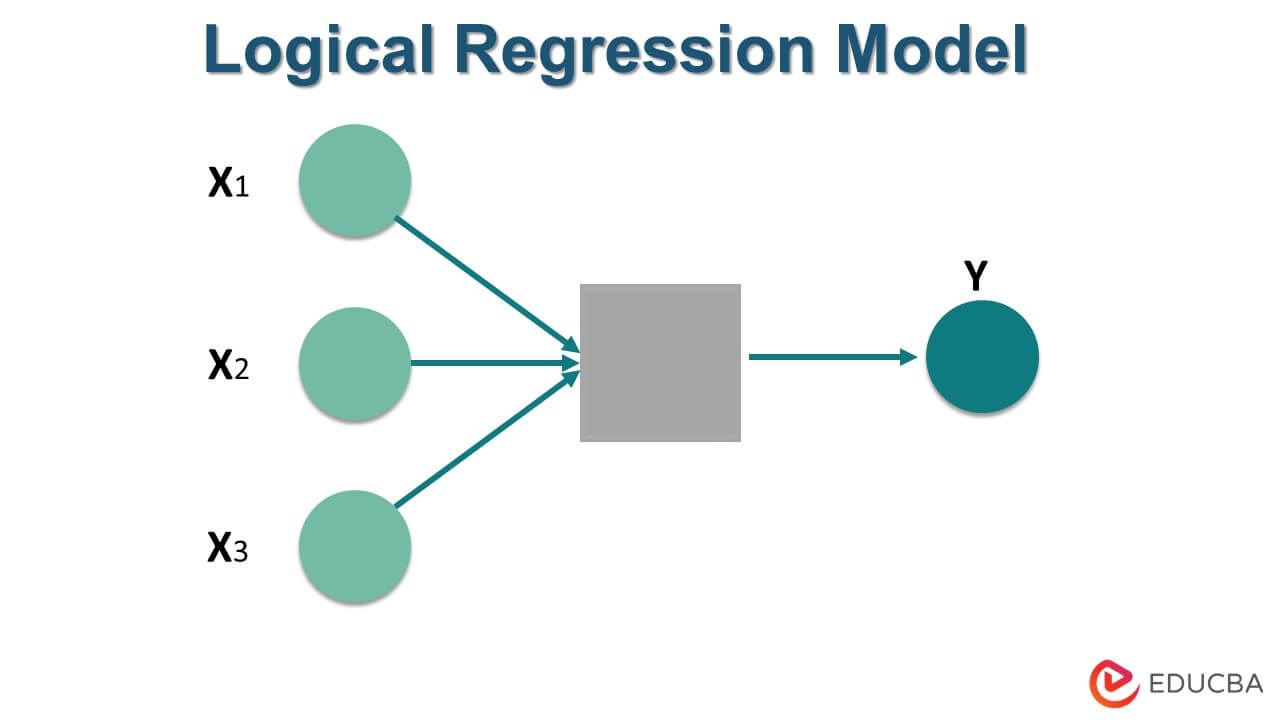
1. Logistic Regression: Logistic regression is a commonly used algorithm for binary classification tasks. It uses a logistic function to model the relationship between the input variables and the probability of a binary outcome.
It forecasts the Probability that a sample will fall into a specific class.
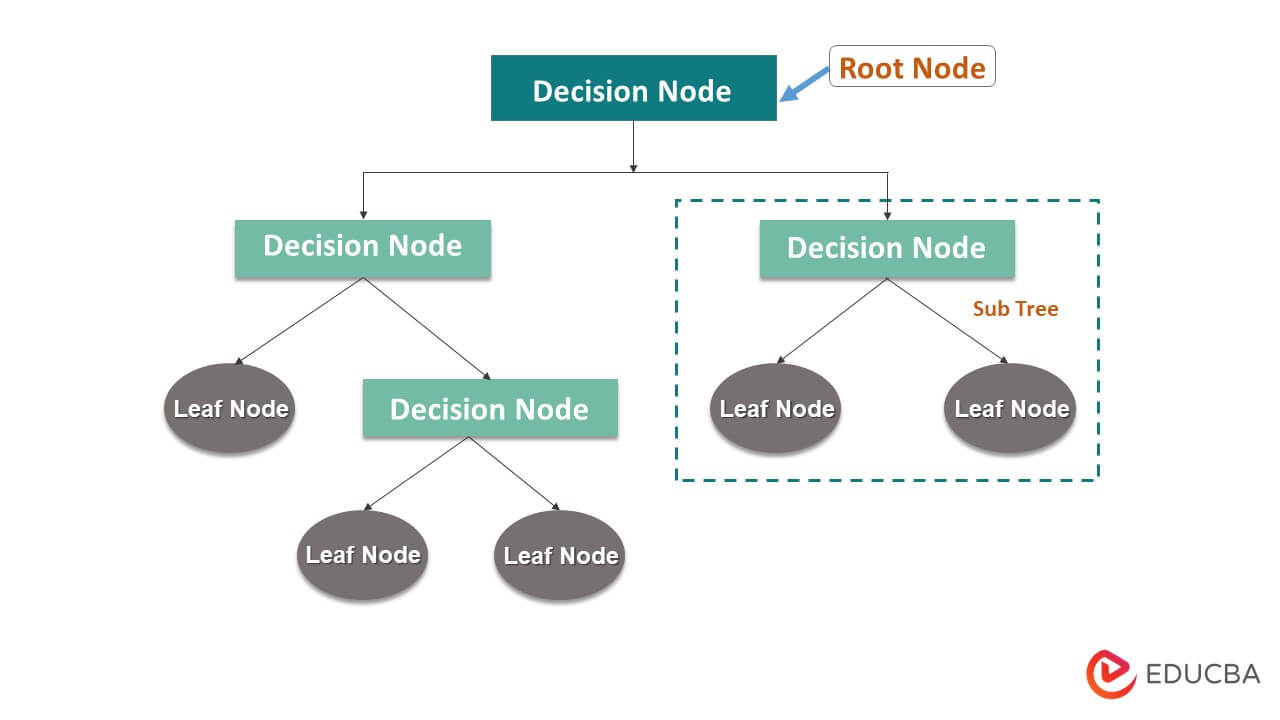
2. Decision Trees: Decision trees, a versatile and powerful algorithmic tool, offer a wide range of applications in both classification and regression tasks.
They divide the input space into regions based on the values of the input features, resulting in a tree-like structure. Decision trees make predictions by following the paths of the tree from the root to the leaf nodes.
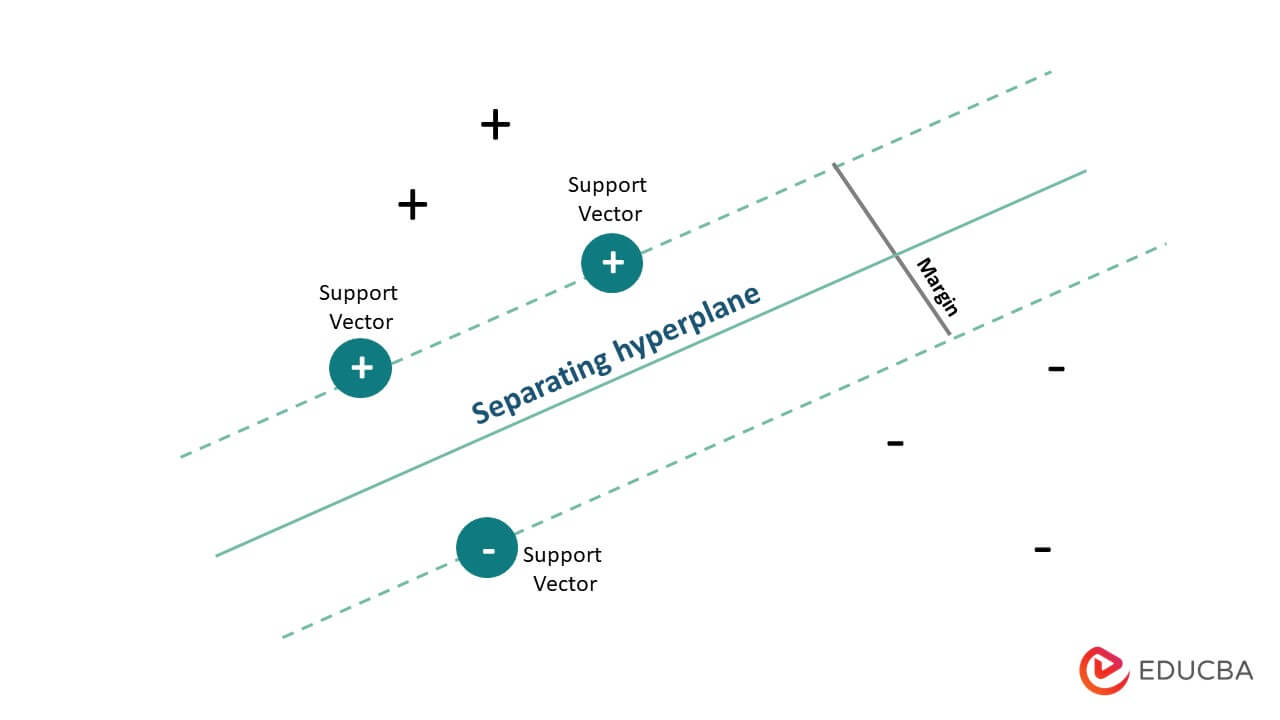
3. Support Vector Machines (SVM): SVM (Support Vector Machines), a formidable algorithm in machine learning, stands tall as a versatile tool capable of tackling binary and multi-class classification tasks. It finds the optimal hyperplane that maximizes the margin between different classes in the feature space.
SVM can also handle non-linear relationships by using kernel functions.
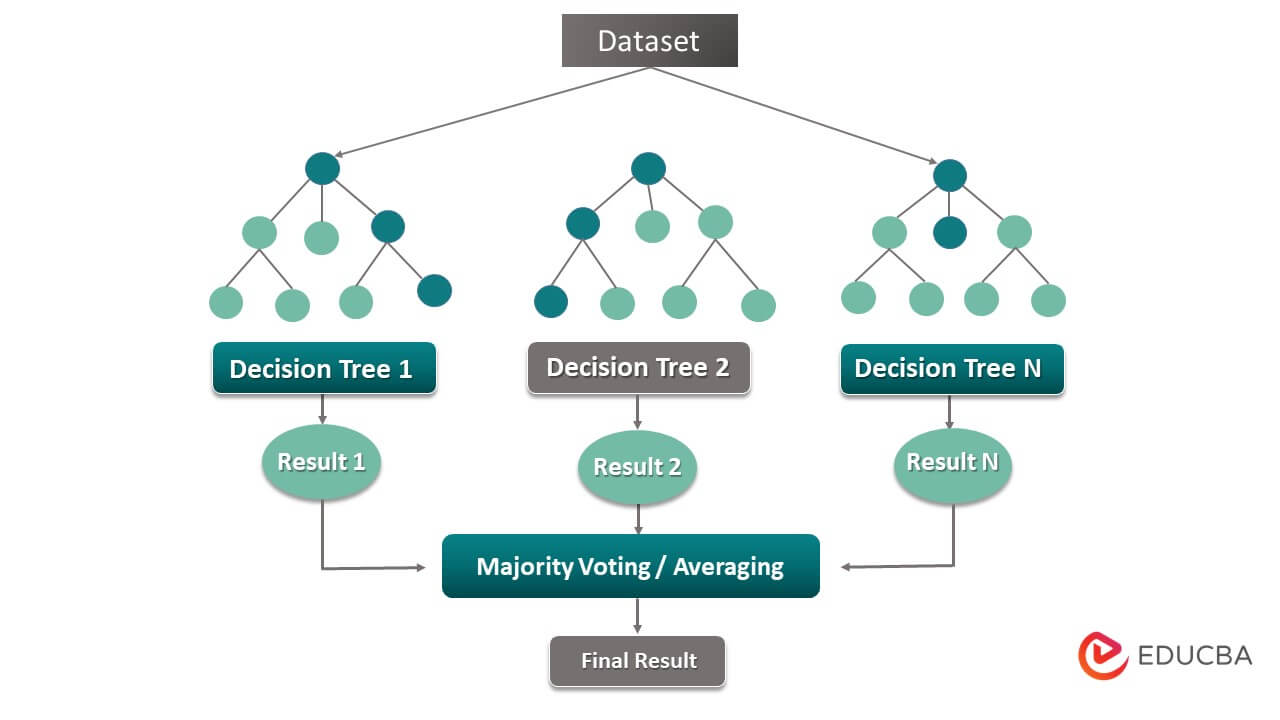
4. Random Forests: Random forests, an ensemble learning method, wield the power of collective wisdom by seamlessly combining multiple decision trees. In this remarkable approach, each tree in the forest is trained on a unique subset of the data, resulting in diverse perspectives. The final prediction emerges through a brilliant fusion of individual tree predictions, creating a robust and accurate model.
These algorithms provide a foundation for solving various supervised learning problems. They have different strengths and weaknesses, and the choice of algorithm depends on factors such as the problem’s nature, the dataset’s size and complexity, interpretability requirements, and computational considerations.
| Aspect | Supervised Learning | Unsupervised Learning |
| Labeled data | Requires labeled training data | Works with unlabeled data. |
| Training and Testing | Training on Labeled data, evaluation on test data. | No explicit separation of training and test data. |
| Goal | Learn a mapping function that connects input to output data. | Discovering patterns, Structures, or relationships. |
| Types of problems | Classification, regression | Clustering, dimensionality reduction. |
| Exampled | Linear Regression, logistic regression, decision trees, SVM, and neural network. | K-Means Clustering, hierarchical Clustering, PCA, t-SNE. |
2. Unsupervised Learning
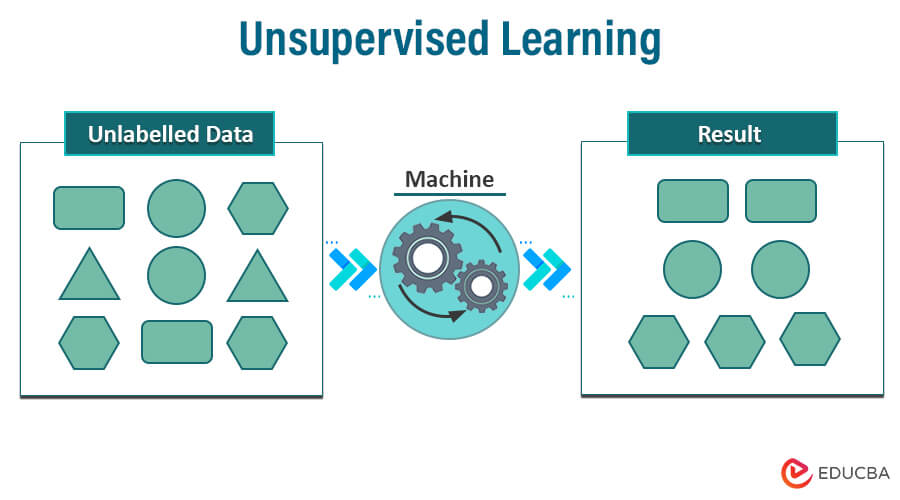
Unsupervised learning, a fundamental branch of machine learning, focuses on extracting valuable information from unlabeled data. This approach allows algorithms to autonomously explore the data to uncover hidden patterns, relationships, and structures. Here are some key algorithms associated with unsupervised learning:
Clustering
It allows for discovering hidden structures and patterns in unlabeled data. It can provide valuable insights and facilitate exploratory data analysis.
The nature of the data determines the clustering algorithm chosen, the required number of clusters, and the specific task at hand.
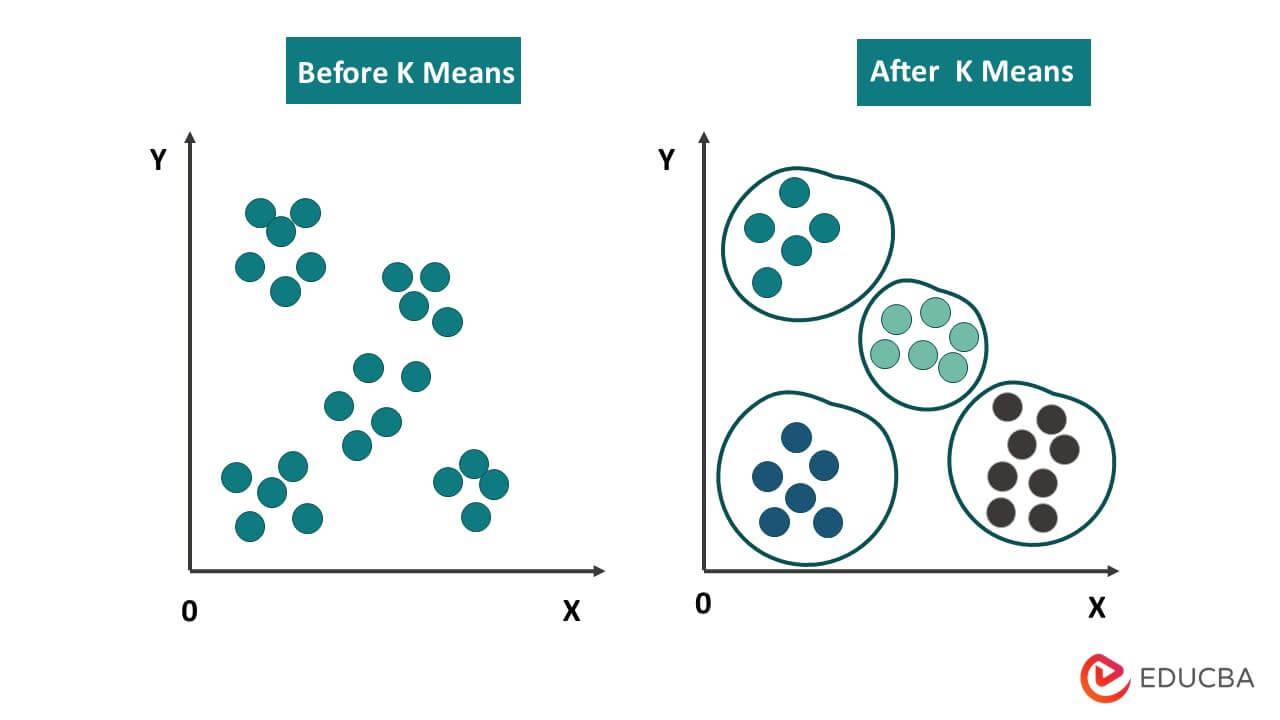
1. K-means Clustering: K-means is a popular clustering algorithm that partitions data into K clusters based on the similarity of data points. The objective of this approach is the within-cluster sum of squared distances.
K-means is an iterative algorithm where each data point is assigned to the cluster with the nearest centroid, and the centroids are updated until convergence.
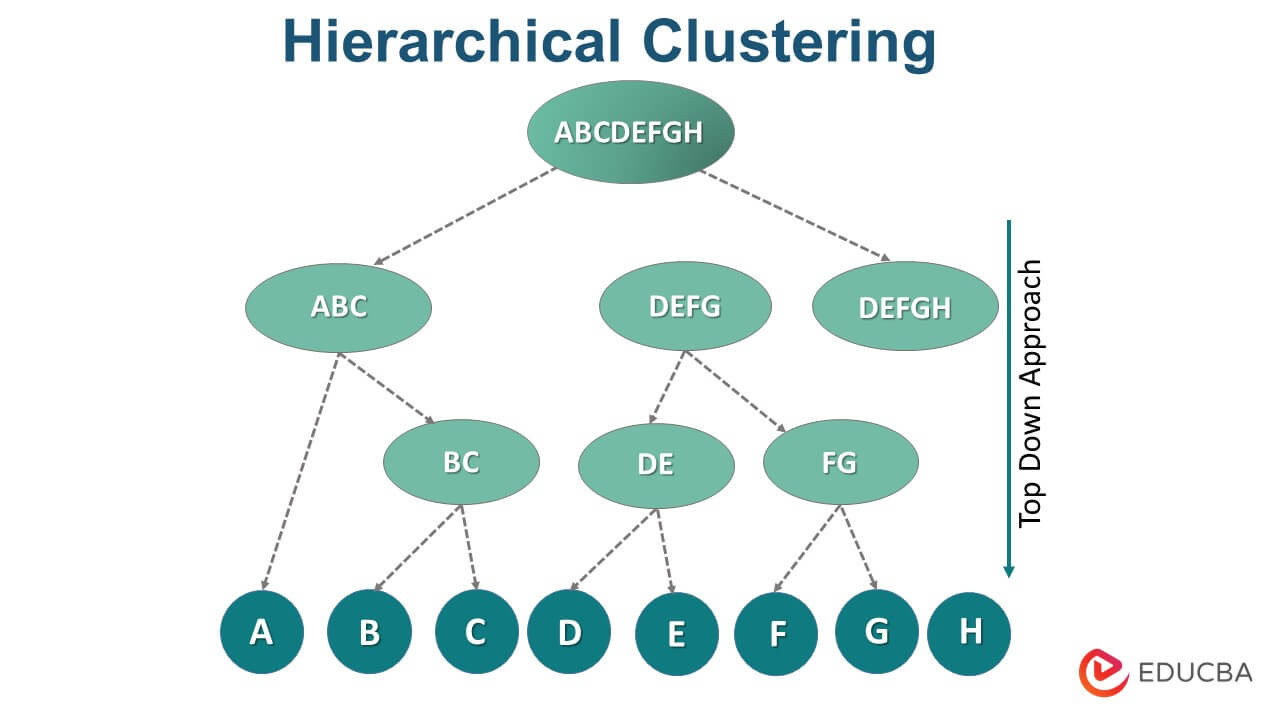
2. Hierarchical Clustering: Hierarchical clustering builds a hierarchy of clusters in a tree-like structure known as a dendrogram. It can be agglomerative, where each data point starts as a separate cluster and is merged iteratively, or divisive, where all data points start in one cluster and are split recursively.
Hierarchical clustering provides insights into the hierarchical relationships between data points.
Dimensionality reduction
1. Principal Component Analysis (PCA): PCA is a common method for reducing dimensionality. It transforms high-dimensional data into a lower-dimensional space while preserving the maximum variance in the data. PCA identifies the principal components, and linear combinations of the original features, capturing the directions of maximum variability in the data.
2. t-SNE (t-Distributed Stochastic Neighbor Embedding): t-SNE is a nonlinear dimensionality reduction method that strongly emphasizes preserving the data’s local structure.
It maps high-dimensional data to a lower-dimensional space, such as 2D or 3D, by minimizing the divergence between the distributions of pairwise similarities in the high-dimensional and low-dimensional spaces.
t-SNE is often used for visualizing high-dimensional data and discovering meaningful clusters.
These unsupervised learning algorithms provide valuable tools for exploring and understanding unlabeled data. Unsupervised learning is crucial in exploratory data analysis, anomaly detection, and data preprocessing for supervised learning tasks.
3. Evaluation Metrics
Machine learning models’ performance and efficacy are evaluated using evaluation metrics. The choice of evaluation metrics depends on the specific task, such as classification or regression. Here are some commonly used evaluation metrics for different machine-learning problems:
Accuracy: The percentage of cases correctly classified out of all instances is how accurately something is categorized. It is a commonly used metric for balanced datasets where the classes are evenly distributed.
Precision: It is the ratio of accurately predicted positive instances to all positively anticipated instances. It shows how well the model can identify good occurrences.
Recall: The y recall, also known as sensitivity or true positive rate, measures the proportion of accurately anticipated positive cases to all actual positive instances.
It reflects the model’s ability to identify all positive instances.
F1 Score: The harmonic mean of recall and precision generates the F1 score.
It provides a balanced measurement that takes into account both recall and precision.
- TP: True Positive (correctly predicted positive samples)
- TN: True Negative (correctly predicted negative samples)
- FP: False Positive (incorrectly predicted positive samples)
- FN: False Negative (incorrectly predicted negative samples)
Mean Squared Error (MSE): The average squared difference between the expected and actual values is what the MSE calculates.
It assigns more weight to greater errors, making it more susceptible to outliers.
- n = number of values
- Actual = observed y value
- Forecast = values from the regression
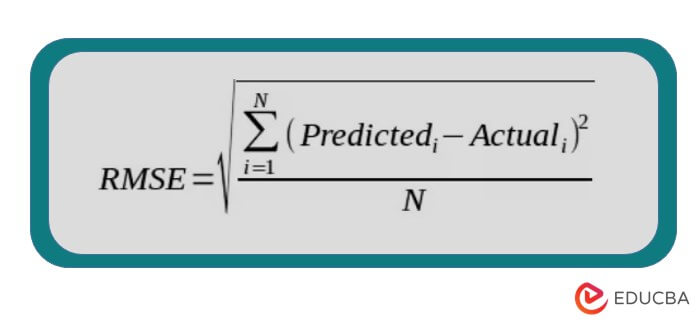
Root Mean Squared Error (RMSE): Root Mean Squared Error (RMSE) is a commonly used metric in regression analysis and machine learning. It is derived from the Mean Squared Error (MSE) by taking the square root of the MSE. It has the advantage of being in the same unit as the target variable, which makes it more interpretable.
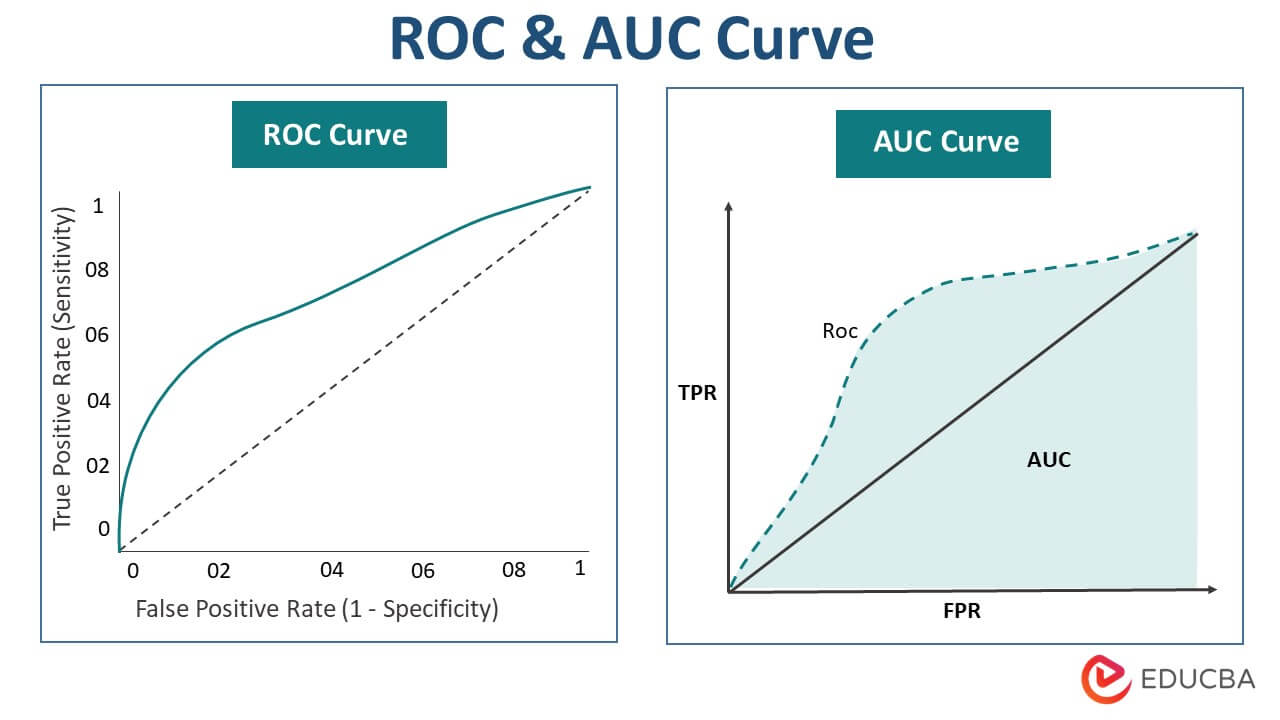
Receiver Operating Characteristic (ROC) curve, Area -Under the Curve (AUC)
ROC curves compare the true positive rate (TPR) and false positive rate (FPR) at different categorization thresholds.
The area under the ROC curve, or AUC, comprehensively evaluates the classifier’s performance at all potential thresholds.
AUC is useful for evaluating the model’s ability to distinguish between classes.
Data Analysis and Visualization
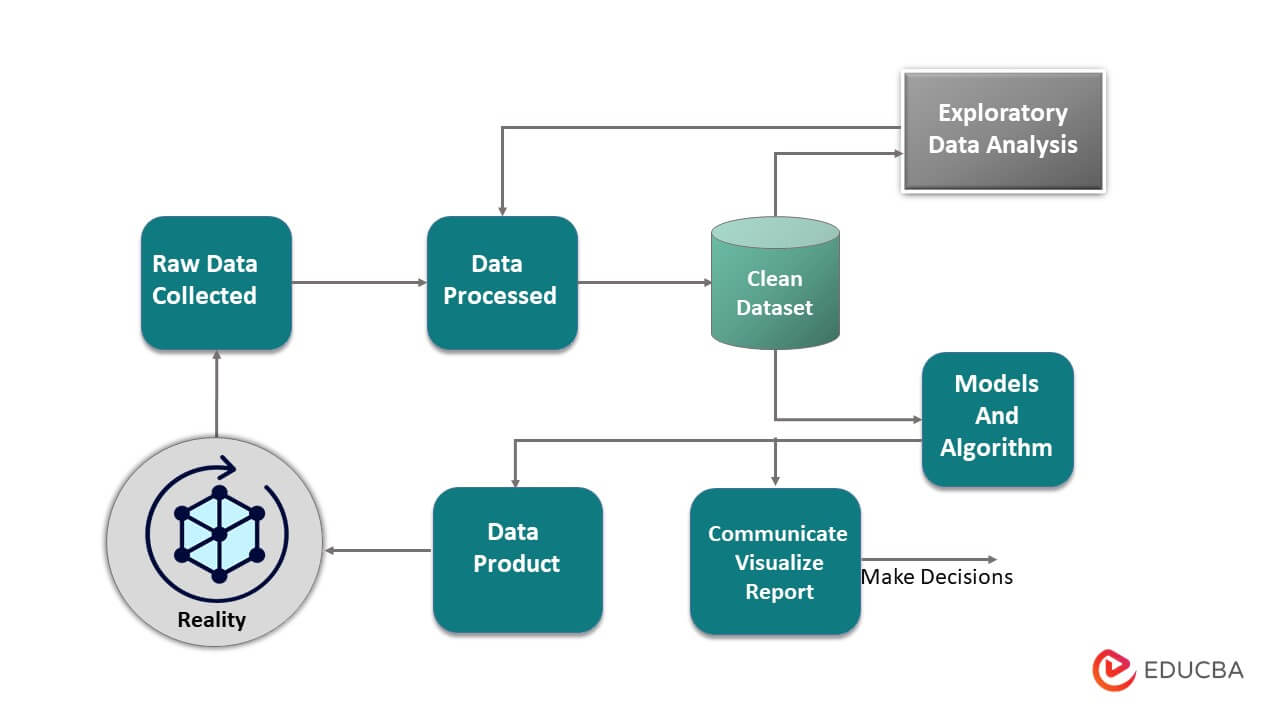
Data visualization and analysis are essential to machine learning. They involve exploring, summarizing, and interpreting data to gain insights and inform decision-making. Here’s a brief overview:
1. Exploratory Data Analysis (EDA)
Exploratory Data Analysis (EDA) is essential in understanding and gaining insights from a dataset. It involves analyzing and visualizing the data to uncover patterns, relationships, and anomalies. Here are some key components of EDA:
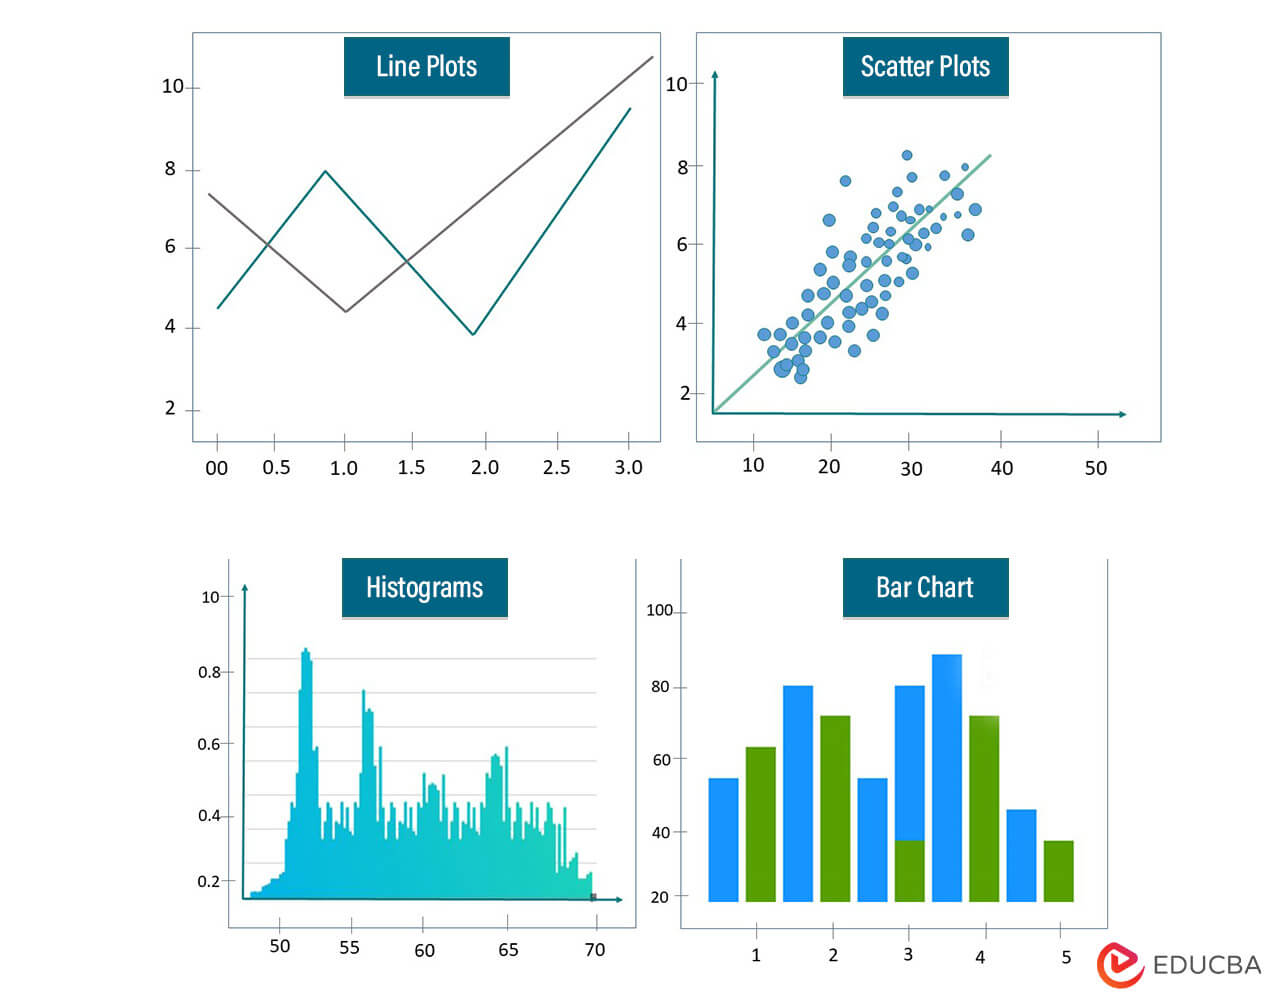
- Data Visualization Techniques: Data visualization plays a crucial role in EDA by representing data visually to reveal patterns and relationships that may not be apparent in raw data. Various charts, graphs, and plots, such as histograms, bar charts, line plots, scatter plots, box plots, and heat maps, can be used. Visualization helps understand data distributions, identify outliers, detect trends, and explore relationships between variables.
- Descriptive Statistics: Descriptive statistics provide summary measures and statistical properties of the data. They help quantitatively summarize the dataset and understand its central tendencies, variability, and shape. Descriptive statistics include mean, median, mode, standard deviation, variance, quartiles, and percentiles. These statistics provide insights into the distribution of variables, identify potential outliers, and support hypothesis testing.
- Data cleaning and handling missing values: EDA cleans the data to guarantee its integrity and caliber. This process includes handling missing values, dealing with outliers, correcting inconsistencies, and transforming data into a suitable format. Imputation techniques such as mean imputation and median imputation can handle missing values, or one can opt for advanced methods like multiple imputation or predictive imputation. Understanding the extent and patterns of missing values helps make informed decisions on handling them appropriately.
EDA enables data scientists to understand the dataset better, identify data issues, and make informed decisions regarding data preprocessing and feature engineering.
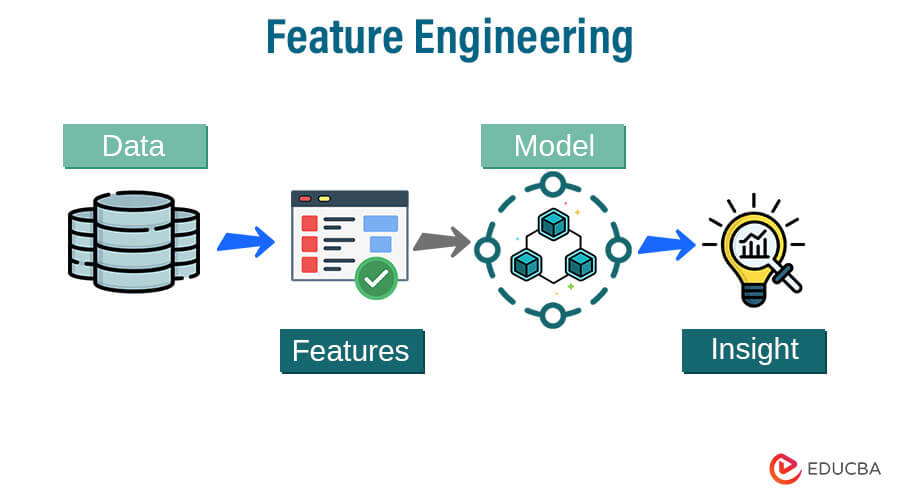
2. Feature Engineering
The process of changing raw data into a format appropriate for machine learning algorithms is known as feature engineering. It involves creating new features, selecting relevant features, and preprocessing existing features to improve the performance and interpretability of models. Here are some key aspects of feature engineering:
- Feature Selection and Extraction
Feature selection aims to identify the most relevant features that have the most predictive power for the target variable. It helps reduce dimensionality and eliminate irrelevant or redundant features, improving model efficiency and reducing overfitting.
Feature extraction involves creating new features from existing ones, such as combining multiple variables, creating interaction terms, or applying mathematical transformations to capture meaningful patterns.
- Handling categorical variables
Represent discrete values or categories like color, gender, or product type. Machine learning algorithms require appropriate encoding for their usage.
Common techniques for handling categorical variables include one-hot encoding, which creates binary indicator variables for each category, and label encoding, which assigns a unique numerical label. The choice of encoding method depends on the data’s nature and the algorithm being used.
- Feature scaling and normalization
Feature scaling brings numerical features to a similar scale to prevent certain features from dominating others.
It guarantees that each feature’s contribution to the learning process of the model is equal.
Common scaling techniques include standardization (subtracting the mean and dividing by the standard deviation) and min-max scaling (scaling values to a specific range, often 0 to 1). Feature normalization is particularly important for algorithms that rely on distance calculations, such as k-nearest neighbors or clustering algorithms.
Tools and Libraries
1. Machine Learning Libraries
- Scikit-learn: Popular machine learning library in Python
Scikit-learn is a comprehensive machine-learning library in Python. It offers a comprehensive selection of methods and tools for numerous tasks, including model evaluation, dimensionality reduction, clustering, regression, and classification. Its user-friendly API and extensive documentation make it popular for both beginners and experienced practitioners.
- TensorFlow, Keras, and PyTorch: Deep learning frameworks
An open-source deep learning framework is TensorFlow from Google. It provides a flexible and efficient ecosystem for building and training various types of neural networks. TensorFlow offers high-level APIs like Keras, which simplifies the process of building neural networks, and lower-level APIs for more advanced customization.
Keras is a Python-based high-level neural network API that works on TensorFlow. It has an easy-to-use interface for creating and training deep learning models. Keras focuses on simplicity and ease of use, allowing users to prototype and experiment with different network architectures quickly.
The Facebook AI Research Lab created PyTorch, an open-source deep learning framework. It is well-known for its dynamic computational graph, which allows for greater model development and debugging flexibility. Torch provides seamless integration with Python and offers a rich ecosystem for developing deep-learning models.
These libraries and frameworks offer a wealth of functionality and support for various machine learning and deep learning tasks. They provide powerful tools and abstractions to simplify the development and training of models, allowing practitioners to focus more on the problem at hand.
2. Data Visualization Libraries
- Matplotlib, Seaborn: Visualization libraries in Python
Matplotlib is a popular Python package for creating a variety of plots and visualizations, including line plots, scatter plots, bar charts, histograms, and more. It offers a high degree of customization and control over plot aesthetics.
Seaborn is a Matplotlib-based Python data visualization package. It offers a more advanced interface for visually appealing and relevant statistical visualizations. Seaborn simplifies the creation of complex visualizations such as heatmaps, violin plots, box plots, and specialized plots for categorical data. It works well with Panda’s data structures as well.
- ggplot2: The visualization library in R
ggplot2 is a powerful and widely used data visualization library in R. It follows the grammar of graphic principles, allowing users to create visually appealing and highly customizable plots.
ggplot2 provides many plot types, including scatter plots, bar charts, line plots, histograms, and more. It emphasizes the concept of layers, making adding and modifying plot elements easy.
Both Matplotlib and Seaborn in Python, and ggplot2 in R, offer extensive functionality and flexibility for creating a variety of visualizations. They provide options for customization, color schemes, and advanced features such as annotations and facet grids. Choosing the right library depends on your specific requirements, programming language preference, and the style of visualization you want to achieve
3. Development Environments
Interactive coding environments for data analysis and machine learning:
- Jupyter Notebook: An open-source web tool called Jupiter Notebook enables you to create and share documents with real-time code, equations, graphics, and text. Julia, Python, and R are just a few programming languages it supports. Jupyter Notebook provides an interactive and exploratory coding environment, making it ideal for data analysis, prototyping, and sharing research findings.
- Anaconda: Anaconda distributes the Python and R programming languages for data science and machine learning. It has a package and environment manager that allow you to easily install, manage, and switch between different libraries and dependencies. Anaconda also includes Jupyter Notebook and other essential tools for data analysis.
- Integrated Development Environments (IDEs): IDEs provide comprehensive coding environments with features like code editors, debugging tools, project management, and version control integration. Some popular IDEs for data analysis and machine learning include
- Visual Studio Code: Visual Studio Code is a lightweight, extensible code editor that supports multiple programming languages. It offers a rich set of extensions and integrates well with Jupyter Notebooks, making it a versatile choice for data analysis and machine learning tasks.
- PyCharm: An effective IDE created especially for Python development is called PyCharm. It includes sophisticated code analysis, debugging, and profiling capabilities. PyCharm offers features tailored for data scientists, such as integration with Jupyter Notebooks, support for scientific libraries, and database connectors.
- RStudio: The R programming language has an integrated development environment called RStudio. It provides a user-friendly interface, code editing, debugging, and package management tools specifically designed for R programming. Data analysts and statisticians frequently use RStudio for data exploration, visualization, and statistical modeling.
These development environments offer different features and capabilities, catering to other preferences and workflows. The choice of development environment depends on factors such as programming language preference, project requirements, available resources, and personal preferences for user interface and functionality.
Conclusion – Prerequisites for Machine Learning
In conclusion, to pursue machine learning effectively, it is essential to have a strong foundation in mathematics, including calculus, linear algebra, and probability theory.
Additionally, proficiency in programming languages such as Python, R, or others is crucial for implementing and experimenting with machine learning algorithms. Familiarity with data manipulation and visualization techniques and using relevant libraries aid in preprocessing and analyzing data. Understanding supervised and unsupervised learning algorithms and evaluation metrics enables the effective development and evaluation of machine learning models. By acquiring these prerequisites, one can embark on the journey of exploring and solving complex problems using machine learning techniques.
Recommended Articles
We hope that this EDUCBA information on “Prerequisites for Machine Learning” was beneficial to you. You can view EDUCBA’s recommended articles for more information.
