Updated March 31, 2023
Introduction to PySpark groupby multiple columns
PYSPARK GROUPBY MULITPLE COLUMN is a function in PySpark that allows to group multiple rows together based on multiple columnar values in spark application. The Group By function is used to group data based on some conditions, and the final aggregated data is shown as a result. Group By in PySpark is simply grouping the rows in a Spark Data Frame having some values which can be further aggregated to some given result set.
The identical data are arranged in groups, and the data is shuffled accordingly based on partition and condition. This condition can be based on multiple column values Advance aggregation of Data over multiple columns is also supported by PySpark Group By. Post performing Group By over a Data Frame; the return type is a Relational Grouped Data set object that contains the aggregated function from which we can aggregate the Data.
The syntax for PySpark groupby multiple columns
The syntax for the PYSPARK GROUPBY function is:-
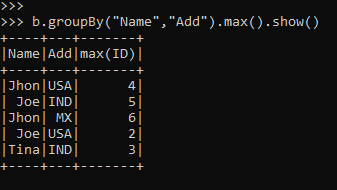
b.groupBy("Name","Add").max().show()- b: The PySpark DataFrame
- ColumnName: The ColumnName for which the GroupBy Operations needs to be done accepts the multiple columns as the input.
- max() A Sample Aggregate Function
Screenshot:-
Working of PySpark groupby multiple columns
Let us see somehow the GROUPBY function works in PySpark with Multiple columns:-
The GROUPBY multiple column function is used to group data together based on the same key value that operates on RDD / Data Frame in a PySpark application. The multiple columns help in the grouping data more precisely over the PySpark data frame.
The data having the same key based on multiple columns are shuffled together and is brought to a place that can group together based on the column value given. The shuffling happens over the entire network, and this makes the operation a bit costlier.
The one with the same key is clubbed together, and the value is returned based on the condition.
GroupBy statement is often used with an aggregate function such as count, max, min,avg that groups the result set then.
Group By can be used to Group Multiple columns together with multiple column names. Group By returns a single row for each combination that is grouped together, and an aggregate function is used to compute the value from the grouped data.
Example of PySpark groupby multiple columns
Let us see some Example of how PYSPARK GROUPBY MULTIPLE COLUMN function works:-
Let’s start by creating a simple Data Frame over which we want to use the Filter Operation.
Creation of DataFrame :-
data1 = [{'Name':'Jhon','ID':1,'Add':'USA'},{'Name':'Joe','ID':2,'Add':'USA'},{'Name':'Tina','ID':3,'Add':'IND'},{'Name':'Jhon','ID':4,'Add':'USA'},{'Name':'Joe','ID':5,'Add':'IND'},{'Name':'Jhon','ID':6,'Add':'MX'}]
a = sc.parallelize(data1)
b = spark.createDataFrame(a)
b.show()
Output:
Let’s start with a simple groupBy code that filters the name in Data Frame using multiple columns
b.groupBy("Name", "Add")The return type being a GroupedData Objet
pyspark.sql.group.GroupedData object at 0x0000022C66668908>This will Group the element with the name and address of the data frame.
The element with the same key are grouped together, and the result is displayed.
Post aggregation function, the data can be displayed. Here we are using the Max function that will give the Max ID post group of the data.
b.groupBy("Name","Add").max().show()Output:
Let’s try to understand more precisely by creating a data Frame with one than one column and using an aggregate function that here we will try to group the data in a single column and will analyze the result.
data1 = [{'Name':'Jhon','ID':2,'Add':'USA'},{'Name':'Joe','ID':3,'Add':'USA'},{'Name':'Tina','ID':2,'Add':'IND'}]A sample data is created with Name, ID, and ADD as the field.
a = sc.parallelize(data1)RDD is created using sc.parallelize.
b = spark.createDataFrame(a)Created DataFrame using Spark.createDataFrame.
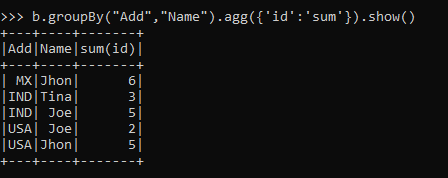
The SUM that is an Aggregate function will be displayed as the output.
b.groupBy("Add","Name").agg({'id':'sum'}).show()Output:
Let’s check out some more aggregation functions using groupBy using multiple columns.
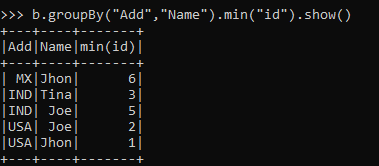
To Fetch the minimum Data.
b.groupBy("Add","Name").min("id").show()Output:
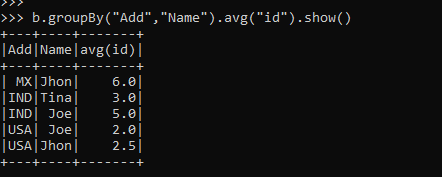
To get the average using multiple columns
b.groupBy("Add","Name").avg("id").show()Output:
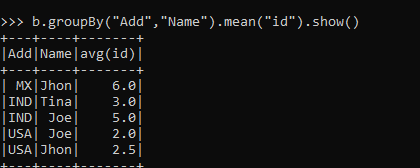
To get the mean of the Data by grouping the multiple columns.
b.groupBy("Add","Name").mean("id").show()Output:
These are some of the Examples of GroupBy Function using multiple in PySpark.
Note:
1. PySpark Group By Multiple Columns working on more than more columns grouping the data together.
2. PySpark Group By Multiple Columns allows the data shuffling by Grouping the data based on columns in PySpark.
3.PySpark Group By Multiple Column uses the Aggregation function to Aggregate the data, and the result is displayed.
4. PySpark Group By Multiple Column helps the Data to be more precise and accurate that can be used further for data analysis.
Conclusion
From the above article, we saw the use of groupBy Operation in PySpark. From various examples and classification, we tried to understand how the GROUPBY method works with multiple columns in PySpark and what are is used at the programming level.
We also saw the internal working and the advantages of having GroupBy in Spark Data Frame and its usage for various programming purpose. Also, the syntax and examples helped us to understand much precisely the function.
Recommended Articles
This is a guide to PySpark groupby multiple columns. Here we discuss the internal working and the advantages of having GroupBy in Spark Data Frame. You may also have a look at the following articles to learn more –


