Updated March 29, 2023
Definition of python bokeh
It is a Python library that allows us to make interactive visualization of browsers. It enables us to create visually stunning graphics. We can use Bokeh to create JavaScript-powered visualizations without having to write any JavaScript. Bokeh is a Python data visualization library that provides high performance. Bokeh output is available in a variety of formats, including notebook, html, and server. Bokeh plots can be included in Flask applications.
What is python bokeh?
- Users can choose between two different visualization interfaces offered by Bokeh. A low-level interface that allows application developers a great deal of freedom. A high-level interface for producing visual glyphs.
- As we know it is designed to be displayed in web browsers. This is where Bokeh differs from other visualization libraries.
- Bokeh supports a variety of languages. These bindings generate a JSON file that serves and displays data to modern web browsers.
- It enables us to quickly create complex statistical plots using simple commands. Bokeh provides output in a variety of formats, including HTML, notebook, and server.
- We can also integrate the bokeh visualization into flask and Django apps. Python bokeh can transform visualizations created with other libraries such as matplotlib, seaborn, and ggplot.
- It has the ability to apply interaction and various styling options to visualization.
- Bokeh is primarily used to convert source data into JSON, which is then used as input for BokehJS. Some of the most appealing aspects of Bokeh is, that it provides charts as well as customs charts for complex use cases.
- It has an easy-to-use interface and can be used with notebooks of jupyter. We have complete control over our chart and can easily modify it with custom Javascript.
- It includes a plethora of examples and ideas to get us started, and it is distributed under the BSD license.
- It is very useful and important in python to make interactive browser visualizations.
Using python bokeh
- This module is not coming under at the time of installing python package in our system. We need to install the bokeh module by using the pip command. The below steps show how to use.
- In the first step, we are installing the bokeh module by using the pip command. We can install the bokeh module in any operating system on which python is installed. In the below example, we are installing the bokeh module on UNIX-like systems.
pip install bokeh- After installing all the modules we are opening the python shell by using the python3 command.
python3- After login into the python shell in this step, we are checking bokeh package is installed in our system.
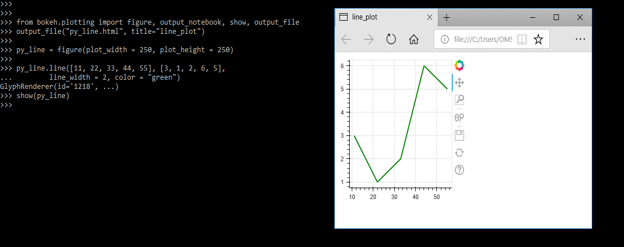
from bokeh.plotting import show output_notebook- After checking the bokeh module in this step we are plotting the line by using the python bokeh module. In the below example first, we have to import the figure, output_file, and show the module by using bokeh.plotting package. Then we have to call the output_file method. Then we have to configure the line by setting the parameter name as plot_width and plot_height. After configuring the setting parameter of the line then we have adding the line renderer. After adding the line renderer we have shown the result of a line are as follows.
Code –
from bokeh.plotting import output_file, figure, show
output_file ("py_line.html", title="line_plot")
py_line = figure (plot_width = 250, plot_height = 250)
py_line.line ([11, 22, 33, 44, 55], [3, 1, 2, 6, 5],
line_width = 2, color = "green")
show (py_line)
Python bokeh Interactive Plots
- Interactive plots are mid-level interface that focuses on creating visual glyphs. We create a visualization by combining various visual elements and tools (dots, circles, lines, patches, and so on).
- Plots are created with a set of tools and visual styles by default. We need to follow the below steps to create interactive plots which are as follows.
-
- Import a library, methods, or functions from another program.
- Choose a web browser.
- Turn on a character (similar to matplotlib)
- Following plotting operations will have an impact on the generated figure.
- Consider it visually.
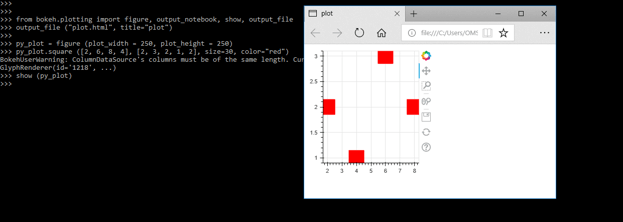
- The below example shows interactive box plots as follows. A box plot is a type of plot that is used to display statistical data. It is useful for summarizing the data.
Code –
from bokeh.plotting import output_file, figure, show
output_file ("plot.html", title="plot")
py_plot = figure (plot_width = 250, plot_height = 250)
py_plot.square ([2, 6, 8, 4], [2, 3, 2, 1, 2], size=30, color="red")
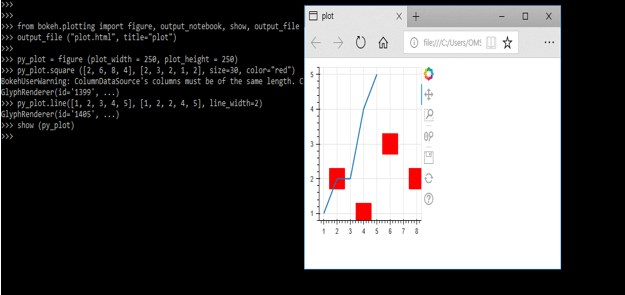
show (py_plot)- In the below example we are combining the two different visual elements in the plot as follows.
Code –
from bokeh.plotting import output_file, figure, show
output_file ("plot.html", title="plot")
py_plot = figure (plot_width = 250, plot_height = 250)
py_plot.square ([2, 6, 8, 4], [2, 3, 2, 1, 2], size=30, color="red")
py_plot.line ([1, 2, 3, 4, 5], [1, 2, 2, 4, 5], line_width=2)
show (py_plot)
Python bokeh Charts
- Python bokeh first converts the data source into a JSON file, which is then used as input for BokehJS. Bokeh is a Python data visualization library. Bokeh, like Seaborn, is a Python package for data visualization, but its plots are rendered in HTML and JavaScript.
- It is a high-level interface for displaying information in standard visualization format. Box plots, bar charts, area plots, heat maps, donut charts, and many more are examples of these forms. Below steps shown to create python, bokeh charts are as follows.
- Import the library as well as the functions/methods.
- Prepare the information
- Configure mode of output
- Make a chart
- Visualize graph
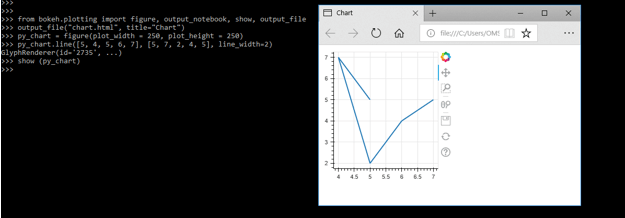
- The below example shows create a line chart as follows.
Code –
from bokeh.plotting import output_file, figure, show
output_file ("chart.html", title="Chart")
py_chart = figure (plot_width = 250, plot_height = 250)
py_chart.line ([5, 4, 5, 6, 7], [5, 7, 2, 4, 5], line_width=2)
show (py_chart)
Conclusion
Python bokeh enables us to quickly create complex statistical plots using simple commands. Bokeh provides output in a variety of formats, including HTML, notebook, and server. Python bokeh is a Python library that allows us to make interactive visualization of browsers. It enables us to create visually stunning graphics.
Recommended Articles
This is a guide to Python bokeh. Here we discuss the Definition, What is python bokeh, Python bokeh Charts, and examples with code. You may also have a look at the following articles to learn more –
