Updated December 22, 2023
What is Python yfinance
Python yfinance is a popular open-source library programmers use to access financial data from Yahoo Finance. It offers a convenient way to download historical and real-time information on stocks, bonds, currencies, and even cryptocurrencies. Think of it as a bridge between your code and the vast market data on Yahoo Finance. With yfinance, you can analyze trends, build trading models, and even automate investment decisions.
Table of Contents
- What is yfinance
- How to Install Finance?
- Implementation
- Fetching Stock Data
- Basic Data Exploration
- Retrieving Historical Stock Data
- Analyzing Stock Performance
- Building a Simple Financial Dashboard
- Retrieving Historical Market Prices
- Advanced Analysis
- Best practices and tips
Key Takeaways
- Open-source tool: Pulls market data from Yahoo Finance’s public APIs.
- Pythonic & threaded: Easy to use and efficient for data retrieval.
- Market data: Download historical & real-time quotes, charts, and options.
- Research & Education: Ideal for learning about financial markets.
- Personal use only: Respect Yahoo’s terms and avoid commercial applications.
How to Install yfinance?
- Open a terminal or command prompt.
- Ensure you have Python and pip installed.
- Type pip install yfinance and press Enter:
- Wait a few moments while pip downloads and installs yfinance.
- Once complete, you can import yfinance in your Python code.
Implementation
The yfinance module in Python allows us to fetch financial data from Yahoo Finance. We can retrieve this data by specifying a company’s stock symbol or ticker. Tickers, essentially stock symbols, uniquely represent companies in the financial market.
For instance:
- Google’s ticker is “GOOGL”
- Facebook’s ticker is “FB”
- Amazon’s ticker is “AMZN”, and so on.
To use yfinance, we input the ticker symbol as an argument within the function. This module enables us to access various financial data points for analysis or display. We can collect historical stock prices, trading volumes, market caps, and more data.
Here are examples of Python programs utilizing yfinance to collect data. These programs demonstrate how to access and utilize the financial data provided by the module.
Fetching Stock Data
Example 1:
Look at the following Python program where we will retrieve the financial data of Meta from Yahoo Finance:
First, you need to import the library and then use the Ticker module to retrieve data for a specific stock symbol.
import yfinance as yf

# Define the stock ticker symbol
stock_symbol = 'Meta'  # Meta Inc.'s stock symbol

# Create a Ticker object for the stock symbol
stock = yf.Ticker(stock_symbol)

# Get stock info
stock_info = stock.info
print("Stock Info:")
print(stock_info)

# Get historical market data for the past month
historical_data = stock.history(period="1mo")
# Fetching data for the past month
print("\nHistorical Market Data:")
print(historical_data)
Output:
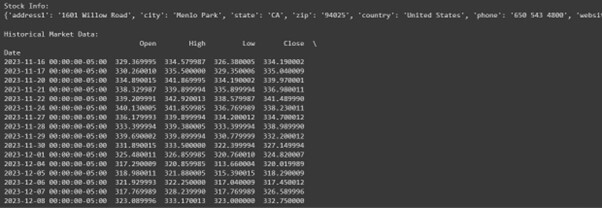
This code will fetch the specified stock symbol (Meta) information using yfinance. It retrieves both general information about the stock and historical market data for the past month. You can adjust the period parameter to fetch data for a different duration, like “1d” for one day, “1y” for one year, etc.
Basic Data Exploration
Basic data exploration with yfinance involves examining key attributes of the fetched stock data.
import yfinance as yf

# Define the stock ticker symbol
stock_symbol = 'Meta'

# Create a Ticker object for the stock symbol
stock = yf.Ticker(stock_symbol)

# Get historical market data for the past month
historical_data = stock.history(period="1mo")  # Fetching data for the past month

# Display basic data exploration
print("Basic Data Exploration:")

# Display summary statistics
print("\nSummary Statistics:")
print(historical_data.describe())

# Display first few rows of data
print("\nFirst few rows of data:")
print(historical_data.head())

# Check for missing values
print("\nMissing Values:")
print(historical_data.isnull().sum())
output:
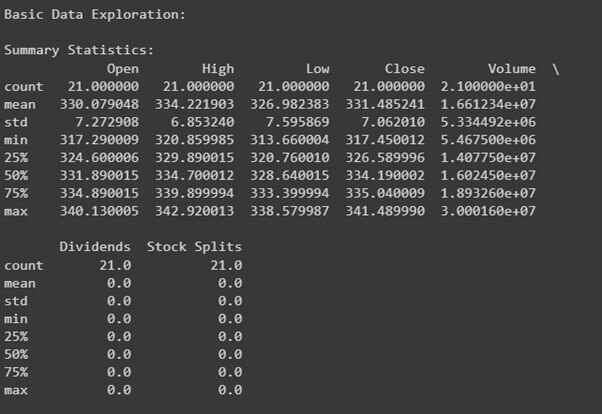
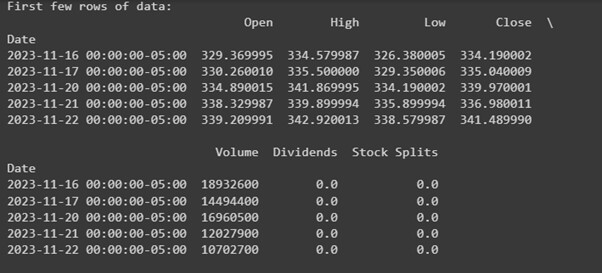
This code fetches historical market data for Meta for the past month and performs basic data exploration:
- Summary Statistics: Provides descriptive statistics of the data (like mean, min, max, etc.).
- First few rows of data: Displays the initial rows to glimpse the data structure.
- Missing Values: Checks for any missing values in the dataset.
Retrieving Historical Stock Data
In this code snippet:
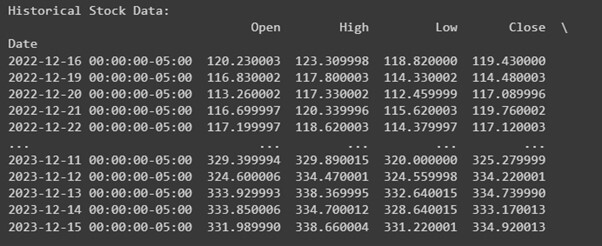
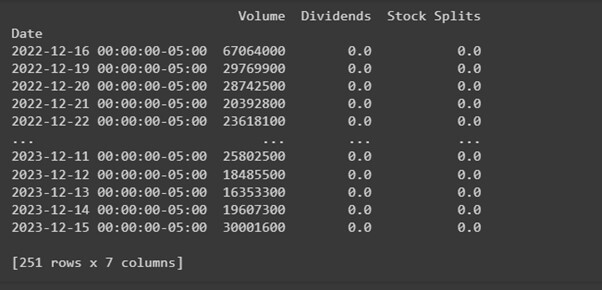
- yfinance is used to fetch historical market data for Meta for the past year (period=”1y”).
- The data is stored in the historical_data variable.
- Printing historical_data displays the retrieved historical stock data, including open, high, low, and Closed prices, volume, and adjusted close prices for each date within the specified period.
You can modify the period parameter to retrieve data for a different duration, such as “5d” for five days, “3mo” for three months, or any other valid period according to your analysis needs.
import yfinance as yf

# Define the stock ticker symbol
stock_symbol = 'Meta'  # Meta stock symbol

# Create a Ticker object for the stock symbol
stock = yf.Ticker(stock_symbol)

# Retrieve historical stock data for a specific timeframe
historical_data = stock.history(period="1y")  # Fetching data for the past year

# Display the retrieved historical stock data
print("Historical Stock Data:")
print(historical_data)
Output:
Analyzing Stock Performance
Analyzing stock performance using yfinance involves calculating various metrics or indicators based on historical stock data.
import yfinance as yf

# Define the stock ticker symbol
stock_symbol = 'Meta'  # Meta stock symbol

# Create a Ticker object for the stock symbol
stock = yf.Ticker(stock_symbol)

# Retrieve historical stock data for a specific timeframe
historical_data = stock.history(period="1y")  # Fetching data for
the past year

# Calculate stock performance metrics


# For example, calculate simple daily returns
historical_data['Daily_Return'] = historical_data['Close'].pct_change()

# Display stock performance metrics
print("Stock Performance Metrics:")
print(historical_data[['Close', 'Daily_Return']].head(10))
Output:
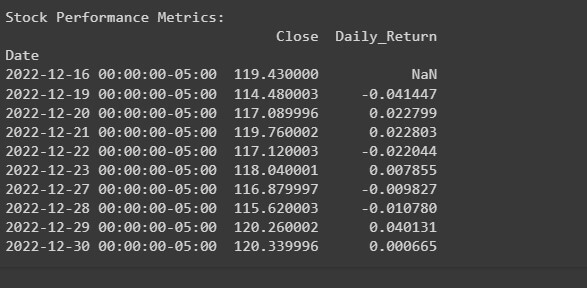
In this example:
- Historical stock data for Meta for the past year is fetched using yfinance.
- A simple performance metric, daily returns, is calculated by taking the percent change in the closing prices.
- The calculated daily returns are stored in the Daily_Return column in the DataFrame.
- The code then displays the closing prices and calculated daily returns for the first 10 days of the retrieved data.
Building a Simple Financial Dashboard
Creating a simple financial dashboard using yfinance involves visualizing stock data in a user-friendly format. Here’s an example using matplotlib to display a basic financial dashboard:
import yfinance as yf

import matplotlib.pyplot as plt

# Define the stock ticker symbol
stock_symbol = 'Meta'

# Create a Ticker object for the stock symbol
stock = yf.Ticker(stock_symbol)

# Retrieve historical stock data for a specific timeframe
historical_data = stock.history(period="6mo")
 # Fetching data for the past 6 months

# Plotting the financial dashboard
plt.figure(figsize=(10, 6))

# Plotting the closing prices
plt.subplot(2, 1, 1)
plt.plot(historical_data['Close'], label='Close Price', color='blue')
plt.title('Stock Prices')
plt.xlabel('Date')
plt.ylabel('Price')
plt.legend()

# Plotting the trading volume
plt.subplot(2, 1, 2)
plt.bar(historical_data.index, historical_data['Volume'],
label='Volume', color='green')
plt.title('Trading Volume')
plt.xlabel('Date')
plt.ylabel('Volume')
plt.legend()

plt.tight_layout()
plt.show()
Output:
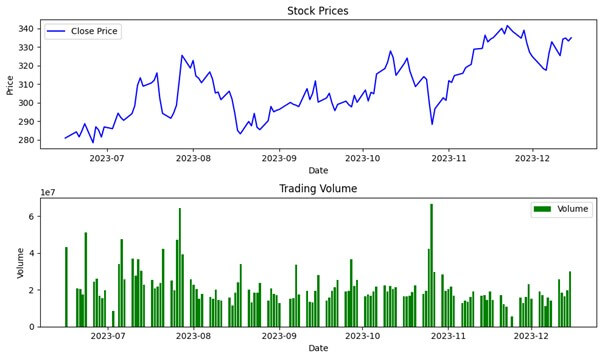
This code snippet creates a simple financial dashboard displaying two plots:
- Closing Prices: Line plot showing the historical closing prices of the stock.
- Trading Volume: Bar plot representing the trading volume over the specified time period.
Retrieving Historical Market Prices
Retrieving historical market prices using yfinance involves fetching data for specific timeframes.
import yfinance as yf

# Define the stock ticker symbol
stock_symbol = 'Meta'  # Meta stock symbol

# Create a Ticker object for the stock symbol
stock = yf.Ticker(stock_symbol)

# Retrieve historical market prices for the last 6 months
historical_prices_6mo = stock.history(period="6mo")  # Fetching data for
the past 6 months

# Display the retrieved historical market prices for the last 6 months
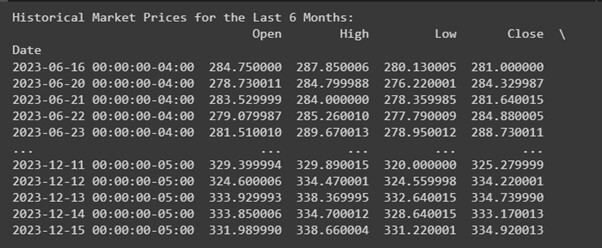
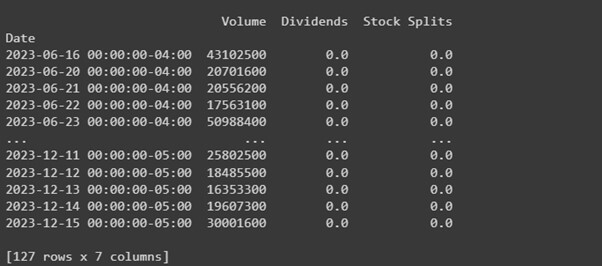
print("Historical Market Prices for the Last 6 Months:")
print(historical_prices_6mo)
Output:
Explanation:
- The code uses yfinance to create a Ticker object for the specified stock symbol, in this case, Meta.
- The history function is then used to retrieve historical market prices for the past year (period=”6 mo”). This fetches open, high, low, and Closed prices, volume, and adjusted close for each date within the specified period.
- The retrieved historical market prices are stored in the historical_prices variable.
- Printing historical_prices displays the fetched historical market price data.
You can adjust the period parameter to fetch data for a different duration, such as “5d” for five days, “3mo” for three months, or any other valid period according to your analysis requirements.
Advanced Analysis with yfinance
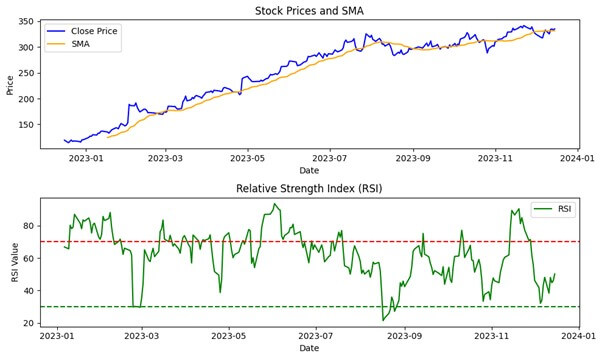
Advanced analysis with yfinance can involve various financial calculations, statistical modeling, or technical indicators based on historical stock data. Here’s an example of using yfinance for calculating the Simple Moving Average (SMA) and Relative Strength Index (RSI) for a stock:
import yfinance as yf
import pandas as pd
import matplotlib.pyplot as plt

# Define the stock ticker symbol
stock_symbol = 'Meta'  # Meta stock symbol

# Create a Ticker object for the stock symbol
stock = yf.Ticker(stock_symbol)

# Retrieve historical market data
historical_data = stock.history(period="1y")  # Fetching data for
the past year

# Calculate Simple Moving Average (SMA)
sma_period = 20  # Define the period for SMA calculation
historical_data['SMA'] = historical_data['Close'].rolling(window=sma_period).mean()

# Calculate Relative Strength Index (RSI)
rsi_period = 14  # Define the period for RSI calculation
delta = historical_data['Close'].diff()
gain = (delta.where(delta > 0, 0)).rolling(window=rsi_period).mean()
loss = (-delta.where(delta < 0, 0)).rolling(window=rsi_period).mean()
rs = gain / loss
historical_data['RSI'] = 100 - (100 / (1 + rs))

# Plotting SMA and RSI
plt.figure(figsize=(10, 6))

# Plotting Closing Prices and SMA
plt.subplot(2, 1, 1)
plt.plot(historical_data['Close'], label='Close Price', color='blue')
plt.plot(historical_data['SMA'], label='SMA', color='orange')
plt.title('Stock Prices and SMA')
plt.xlabel('Date')
plt.ylabel('Price')
plt.legend()

# Plotting RSI
plt.subplot(2, 1, 2)
plt.plot(historical_data['RSI'], label='RSI', color='green')
plt.axhline(70, color='red', linestyle='--')  # Overbought threshold
plt.axhline(30, color='green', linestyle='--')  # Oversold threshold
plt.title('Relative Strength Index (RSI)')
plt.xlabel('Date')
plt.ylabel('RSI Value')
plt.legend()

plt.tight_layout()
plt.show()
Output:
This code fetches historical market data for Meta for the past year and then calculates and plots the Simple Moving Average (SMA) and Relative Strength Index (RSI).
- SMA: Calculated using a 20-day period on the closing prices.
- RSI: Calculated using a 14-day period based on price changes.
The code visualizes the Closing Prices and SMA in one subplot and the RSI in another subplot, with thresholds for overbought and oversold conditions (typically at 70 and 30, respectively) represented by dashed lines.
Best practices and tips for using yfinance include
- Error Handling: Implement robust error handling to manage potential data retrieval and processing issues.
- Data Validation: Always validate the fetched data to ensure accuracy and consistency before performing any analysis or making decisions based on the data.
- Efficient Data Retrieval: Use relevant parameters such as period, start, and end to efficiently retrieve the required data efficiently, minimizing unnecessary data transfer.
- Data Storage: Consider storing fetched data locally or in a database to avoid redundant data requests and optimize performance.
- Integration: Explore integration possibilities with other data analysis tools or platforms to enhance the scope of analysis and visualization.
Conclusion
Python yfinance is a powerful and user-friendly Python library for accessing financial data from Yahoo Finance. With yfinance, users can efficiently fetch stock data, perform basic and advanced analysis, retrieve historical market prices, and build financial dashboards. Its seamless integration with Python makes it an invaluable tool for anyone interested in stock data analysis and financial research.
FAQs
Q1. How do I handle missing data when using yfinance?
Answer: When handling missing data in yfinance, you can use methods like fillna() to fill missing values with a specified data point or interpolate() to estimate and fill missing values based on existing data points.
Q2. Can I use yfinance to compare multiple stocks at once?
Answer: You can use yfinance to fetch data for multiple stocks simultaneously by providing a list of stock ticker symbols when using the Ticker() function, allowing for easy comparison and analysis.
Q3. Is it possible to integrate yfinance with other data analysis tools or platforms?
Answer: Yes, yfinance can be integrated with various data analysis tools and platforms such as pandas, NumPy, and visualization libraries like Matplotlib and Plotly, enabling seamless incorporation of stock data into comprehensive analysis and visualization workflows.
Recommended Articles
We hope this EDUCBA information on “Python yfinance” benefited you. You can view EDUCBA’s recommended articles for more information.
