Updated October 5, 2023
What is Quantitative Easing (QE)?
When a country is in deep financial trouble, its central bank uses a monetary policy called quantitative easing (QE) that involves buying government bonds, paying interest on bank reserves, or purchasing mortgage-backed securities from the open market.
Purchasing these assets helps reduce interest rates in the economy. This, in turn, increases the circulation of money, encouraging businesses and consumers to spend and invest more. All this helps bring an economy back from a financial crisis.
Table of Contents
Key Highlights
- Quantitative easing is the strategy of introducing more money into the market by purchasing large-scale assets and reducing interest rates.
- It makes it easier for consumers and businesses to borrow money and helps them spend more.
- Central banks like the Bank of England and the US Federal Reserve have all used quantitative easing to improve their nation’s economies.
How Does it Work?
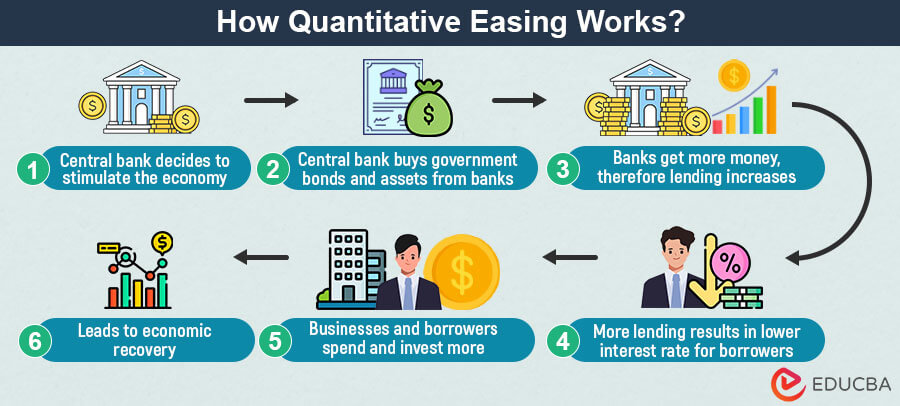
This is how quantitative easing works:
- Identifying the need for quantitative easing: Economists believe QE to be a very aggressive monetary policy. Hence, central banks choose QE only when there is no other option, and the economy is going through extremely turbulent times like recession and deflation.
- Setting targets: Once the central bank decides to implement QE, the next step is to set a specific goal. Usually, the goal is to bring down long-term interest rates to a certain level and to increase money supply. All this is to ensure more borrowing and spending by both consumers and businesses.
- Purchasing assets: After setting goals, the central bank buys financial assets like government bonds and mortgage-backed securities or corporate bonds to increase the money supply.
- Increasing bond prices: The central bank usually buys bonds in bulk, which leads to an increase in demand. And when the demand for something increases substantially, its price also increases. As the price of the bonds increases, their rate of interest decreases.
- More spending: When the borrowing cost (rate of interest) decreases, people start buying homes, cars, and other big investments. On the other hand, businesses also invest more, thus increasing overall spending and boosting the economy.
- Ending QE: Once the central bank achieves the goals it set in the beginning, it gradually stops quantitative easing. They gradually sell the assets and choose not to reinvest the money earned from the sale.
Real-World Example
Following is a detailed example of how the US central bank implemented quantitative easing.
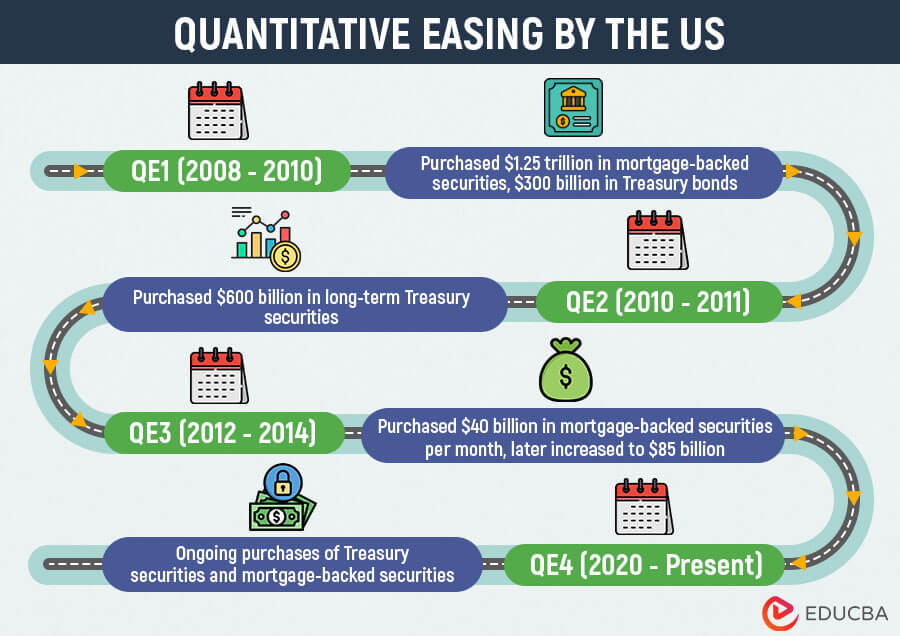
The US Federal Reserve used quantitative Easing (QE) four times between 2008 and 2020.
- Initially, they bought $1.75 trillion in different types of debt to boost the economy after the 2007-2008 recession. It included $200 billion of agency debt, $1.25 trillion in mortgage-backed securities, and $300 billion in long-term treasury debt. This was supposed to increase jobs and business. So, they had planned to decrease these purchases by 2010, but the economy didn’t improve as expected.
- So, in 2010, they started a second round of QE, but this time, they bought only treasury debt until June 2011. Though the economy improved slightly, unemployment was still high.
- In 2012, they began a third round, buying mortgage-backed securities and treasury debt monthly without a specified end date. This round ended in 2014. In 2015, they finally stopped buying bonds as the interest rates were now lower.
- In 2020, due to the pandemic, the Fed had to use QE again. In March 2020, they cut the interest twice. In the same month, they planned monthly purchases of $80 billion of agency debt and $40 billion of mortgage-backed securities without specifying a timeline or total purchase budget.
Experts believe that the first round of QE was the most successful one. However, there is contention over the impact of these QE rounds on the GDP, inflation, stock prices, and consumer confidence.
Quantitative Easing Diagram
The quantitative easing diagram helps us understand how this monetary policy affects various economic factors and finally helps economies recover from financial crises.
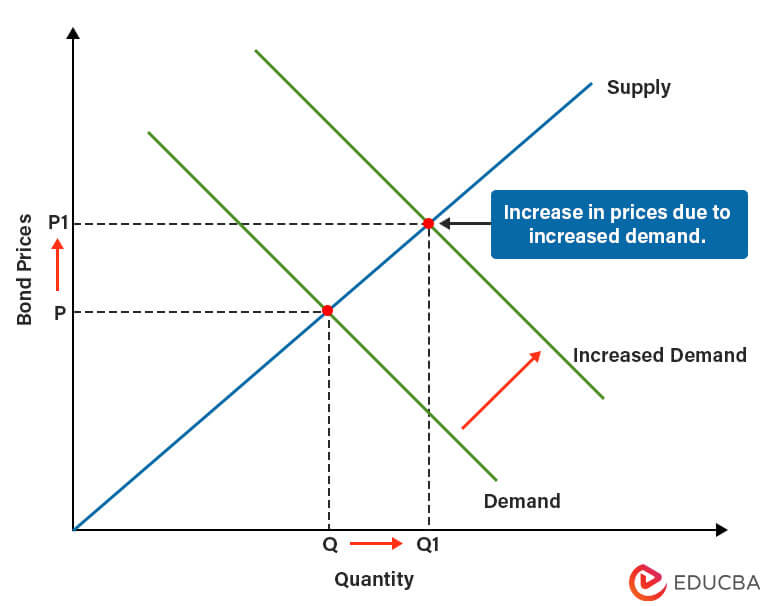
1. Effect on Prices
Where,
- X-axis: Quantity of bonds in an economy.
- Y-axis: Prices of the bonds in an economy.
Key curves on the graph:
- Supply Curve: The supply curve has a straight upward curve. It is because as the price of bonds increases, supply increases too. After all, suppliers want to sell more bonds and make profits.
- Demand Curve: The demand curve is a downward sleeping curve because as price increases, demand falls. This is because buyers don’t want to purchase bonds at higher prices.
How to interpret the graph?
When central banks start purchasing bonds, the demand for the bonds suddenly increases. This, in turn, increases the prices of the bonds. You can see this on the graph where the new demand line meets the supply line, and the prices (P1) are higher than before (P).
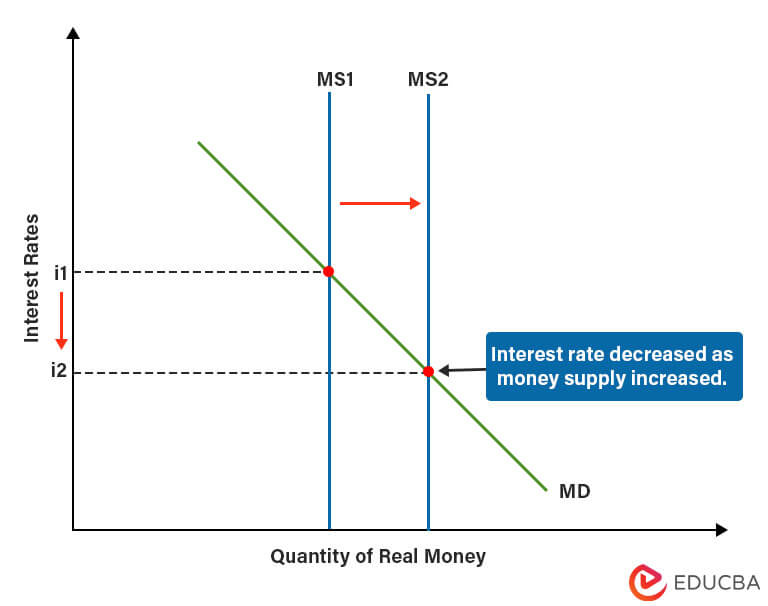
2. Effect on Interest Rates
Where,
- X-axis: Quantity of money in an economy.
- Y-axis: Interest rates in an economy.
Key curves on the graph:
- MD (Money Demand) Curve: This is a downward-sloping curve because when the interest rates are higher, the demand for real money is less, meaning people want to spend less, and vice versa.
- MS (Money Supply) Curve: The MS curve is vertical because the money available in an economy is fixed for a specific period unless there is an unexpected change.
How to interpret the graph?
- When banks purchase government bonds, the money supply in the economy increases. This happens because the quantity of real money available in the economy increases. You can see in the diagram that the money supply curve goes up from MS1 to MS2.
- Next, the point where the money supply and money demand lines meet shows the country’s current interest rate. Now, looking at where the new supply line (MS2) and money demand line (MD) intersect, the interest rate (i2) is lower than the previous interest rate (i1).
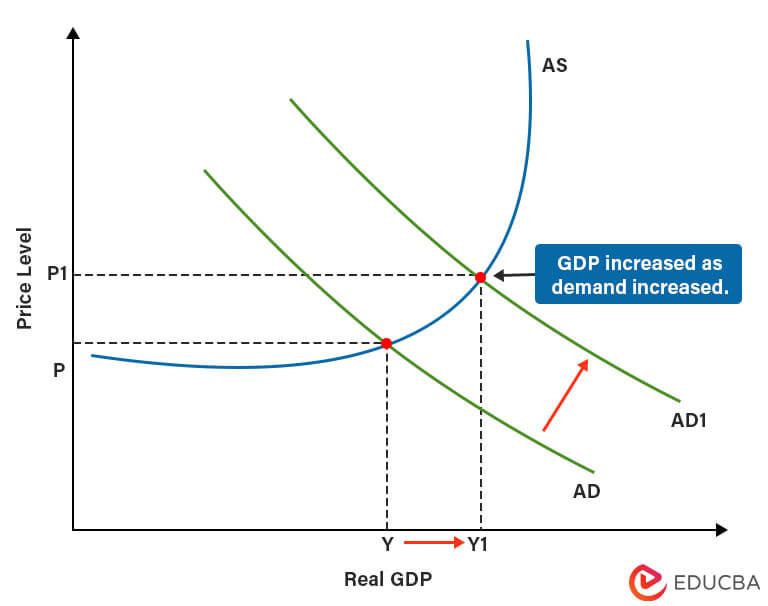
2. Effect on GDP (Gross Domestic Product)
Where,
- X-axis: GDP of an economy.
- Y-axis: Price level in an economy.
Key curves on the graph:
- AD (Aggregate Demand): The AD curve is a downward-sloping line. This is because the aggregate demand is high when GDP is high, and prices are low.
- AS (Aggregate Supply): The aggregate supply has a horizontal curve at the start, which becomes vertical by the end. It means that when prices and GDP are low, aggregate supply is lower, and with improving GDP and increasing price levels, suppliers increase.
How to interpret the graph?
- As we previously saw, the total money in an economy increases when banks buy bonds. As a result, when there is more money in the market, people start spending more, leading to a rise in aggregate demand. We can see that in the graph as the curve moves from AD to AD1.
- In the graph, the point where the new demand curve (AD1) and supply curve (AS) meet, we can see the new increased prices, as well as increased yield (GDP) from Y to Y1. This is how the economy recovers when central banks use quantitative easing.
Effects
The impact of quantitative Easing on an economy depends on its scale and the circumstances in which the banks implement it. Some of the common effects are:
Positive Effects
- Reduction in interest rates: QE lowers the long-term interest rates and increases the borrowing power of consumers and businesses.
- Increasing asset prices: The central bank buys financial assets in large volume, increasing their demand and thus leading to higher stock prices.
- Increased spending power: Lower interest rates and higher stock prices ensure an increased circulation of money in the economy. This encourages consumers and businesses to spend more, thus boosting the economy.
Negative Effects
- Currency weakening: Quantitative easing increases the money supply in the domestic economy. However, as there is suddenly a lot of money in the domestic market, the currency’s value decreases in the international market.
- Risk of inflation: When there is suddenly too much money in circulation, people have more spending power, which means a higher demand for goods and services. And when demand increases, the prices of goods and services go up. This eventually leads to a higher cost of living as everything is more expensive.
Final Thoughts
Quantitative easing is a double-edged sword. On one hand, it can help manage a financial crisis, but on the other, it can also cause issues like inflation. Therefore, central banks should consider their QE programs’ timing, scale, and exit strategies carefully.
Frequently Asked Questions (FAQs)
Q1. Does quantitative easing really work?
Answer: It is complex to decide how effective quantitative easing is in boosting the economy. However, many economists believe it works if done properly. Central banks need to ensure that there’s not excessive money in circulation, and it’s not only the wealthy who benefit.
Q2. How long does quantitative easing last?
Answer: The length of quantitative easing varies from country to country. Generally, quantitative easing programs are temporary and end when the economy starts to recover. However, some central banks may choose to extend the program if they feel it is necessary.
Q3. What is the difference between quantitative easing and quantitative tightening?
Answer: Quantitative tightening is the complete opposite of quantitative easing. While quantitative easing increases the circulation of money in the economy, quantitative tightening decreases it. Quantitative tightening is when a central bank stops buying new assets and instead sells the current assets to increase interest rates and reduce the money supply. Central banks implement quantitative tightening to control inflation.
Q4. Is quantitative easing the same as printing money?
Answer: Although printing more money and quantitative easing can essentially have the same impact, they are not the same. Central banks can simply print more money to increase the money supply, which can cause excessive inflation. That’s why central banks avoid printing money. On the other hand, in QE, the central banks buy government bonds and, in some cases, corporate bonds to increase the circulation of money.
Recommended Articles
This EDUCBA article explains the concept of Quantitative Easing. If you would like to know more about other economics-rated topics, please read the following articles:
