Updated July 26, 2023
Quartile Deviation Formula (Table of Contents)
What is Quartile Deviation Formula?
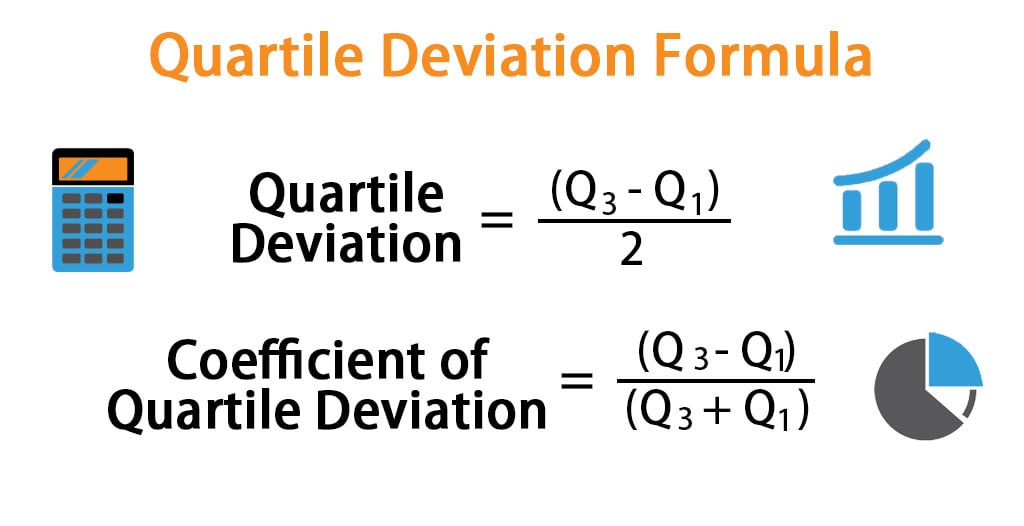
The Quartile Deviation(QD) is the product of half the difference between the upper and lower quartiles.
Mathematically we can define it as:
Quartile Deviation defines the absolute measure of dispersion. Whereas the relative measure corresponding to QD is known as the coefficient of QD, which is obtained by applying a certain set of the formula:
A Coefficient of QD is used to study & compare the degree of variation in different situations.
Examples of Quartile Deviation Formula (With Excel Template)
Let’s take an example to understand the calculation of the Quartile Deviation Formula in a better manner.
Quartile Deviation Formula – Example #1
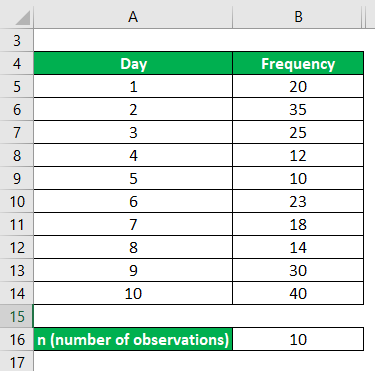
The number of complaints lodged against the stealing of vehicles in a day was calculated for the next 10 days. And the data is given below. Calculate the Quartile Deviation and its coefficient for the given discrete distribution case.
Solution:
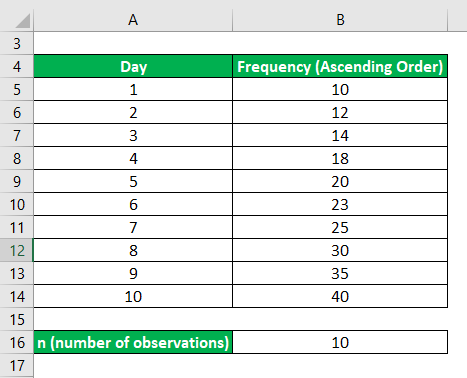
Arrange the data in Ascending Order
Now, we will find the first quartile, which lies halfway between the lowest value and the median, where the third quartile lies halfway between the median and the largest value.
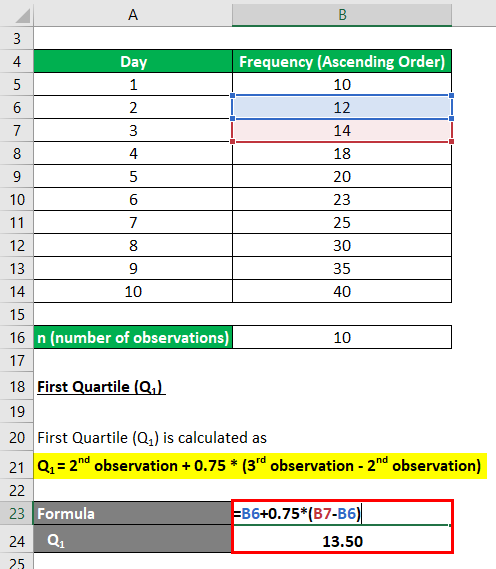
The formula to calculate First Quartile (Q1) is as below:
First Quartile (Q1)
Qi= [i * (n + 1) /4] th observation
Q1= [1 * (10 + 1) /4] th observation
Q1 = [1 * (10 + 1) /4] th observation
Q1 = 2.75th observation
So, 2..75th observation lies between the 2nd and 3rd value in the ordered group, or midways between 12 & 14 therefore
First Quartile (Q1) calculation:
- Q1 = 2nd observation + 0.75 * (3rd observation – 2nd observation)
- Q1 = 12 + 0.75 * (14 – 12)
- Q1 = 12 + 1.50
- Q1 = 13.50
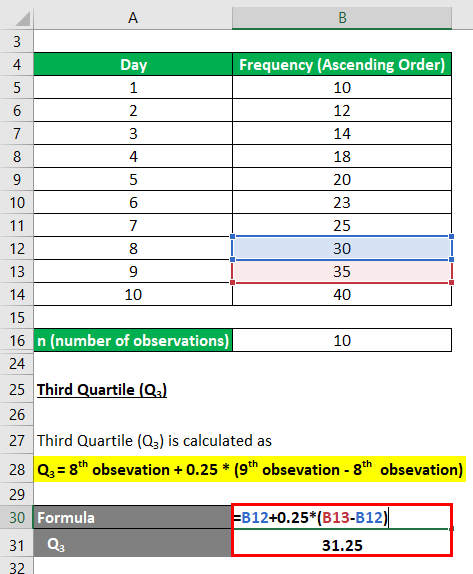
The formula to calculate Third Quartile (Q3) is as below:
Third Quartile (Q3)
Qi= [i * (n + 1) /4] th observation
- Q3 = [1 * (n + 1) /4] th observation
- Q3 = [(10 + 1) /4] th observation
- Q3 = 8.25th observation
So, 8..25th observation lies between the 8th and 9th value in the ordered group, or midways between 30 & 35 therefore
Third Quartile (Q3) calculation:
- Q3 = 8th observation + 0.25 * (9th observation – 8th observation)
- Q3 = 30 + 0.25 * (35 – 30)
- Q3 = 31.25
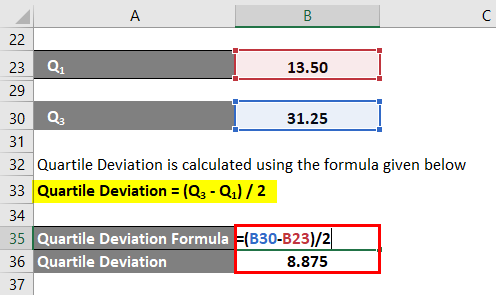
Now using the Quartile values Q1 & Q3. We will calculate its Quartile deviation & its coefficient as follows –
The formula to calculate Quartile Deviation is as below:
Quartile Deviation = (Q3 – Q1) / 2
- Quartile Deviation =(31.25 – 13.50) / 2
- Quartile Deviation = 8.875
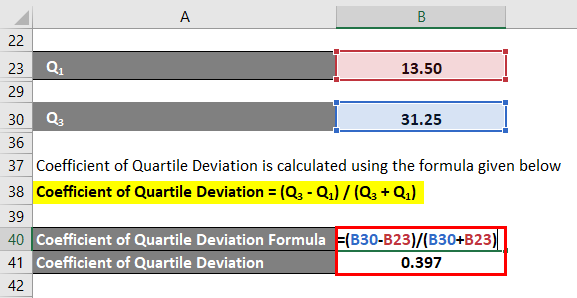
The formula to calculate the Coefficient of Quartile Deviation is as below:
Coefficient of Quartile Deviation = (Q3 – Q1) / (Q3 + Q1)
- Coefficient of Quartile Deviation = (31.25 – 13.50) /(31.25 + 13.50)
- Coefficient of Quartile Deviation =0. 397
Quartile Deviation Formula – Example #2
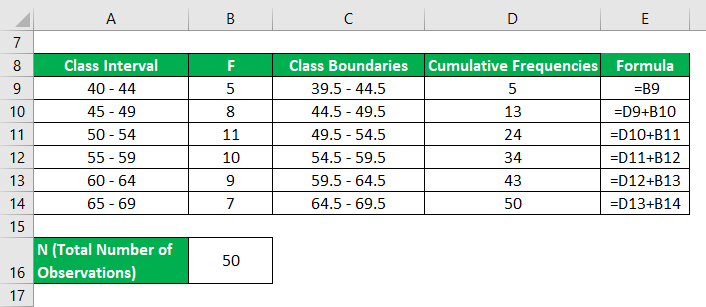
Following are the observations showing the one-day sales of a shopping mall, where we determine the frequency of the first 50 customers of different age groups. Now, we need to Calculate the quartile deviation and coefficient of quartile deviation.
Solution:
In the case of Frequency Distribution, Quartiles can be calculated by using the formula:
Qi = l + (h / f) * ( i * (N/4) – c) ; i = 1,2,3
Where,
- l = Lower Boundary of Quartile Group
- h =Width of Quartile Group
- f = Frequency of Quartile Group
- N = Total Number of Observations
- c = Cumulative Frequency
First, we have to calculate the cumulative frequency table
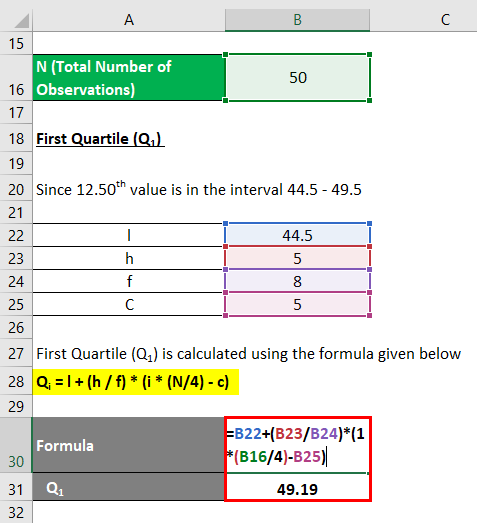
The formula to calculate First Quartile (Q1) is as below:
First Quartile (Q1)
Qi = [ i * (N) /4 ]th observation
- Q1 = [1 * (50) / 4]th observation
- Q1 = 12.50 th observation
Since the 12.50th value is in the interval 44.5 – 49.5
Therefore Group of Q1 is (44.5 – 49.5)
Qi = l + (h / f) *( i * (N/4) – c)
- Q1 = (44.5 + ( 5 /8) * (1 * (50 / 4) – 5)
- Q1 = 44.5 + 4.6875
- Q1 = 49.19
The formula to calculate Third Quartile (Q3) is as below:
Third Quartile (Q3)
Qi = [ i * (N) /4 ]th observation
Q1 =[ i* (N) /4 ]th observation
- Q3= [3 * (50) / 4]th observation
- Q3 = 37.50 th observation
Since 37.50th value is in the interval (59.5 – 64.5)
Therefore Group of Q3 is (59.5 – 64.5)
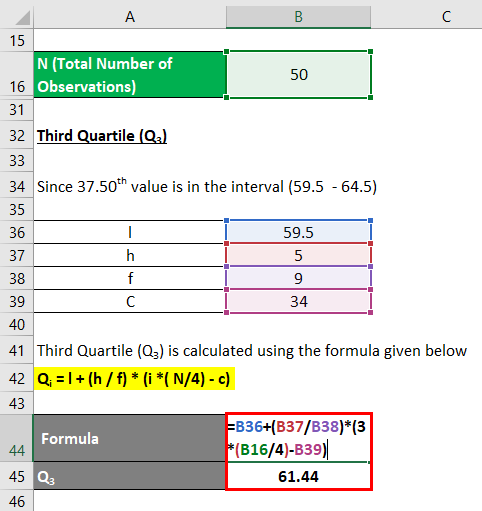
Qi = l + (h / f) *( i * (N/4) – c)
- Q3 = 59.5 + (5 /9) * (3 * (50/4 ) – 34)
- Q3 = 59.5 + 1.944
- Q3 = 61.44
By putting the values into the formulas of quartile deviation and coefficient of quartile deviation, we get:
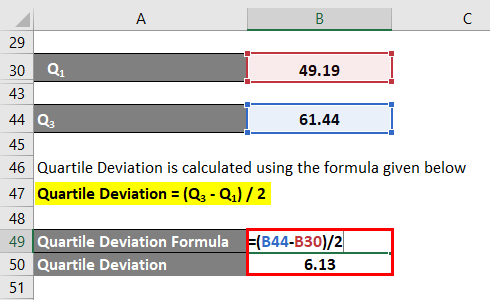
The formula to calculate Quartile Deviation is as below:
Quartile Deviation = (Q3 – Q1) / 2
- Quartile Deviation = (61.44 – 49.19) /2
- Quartile Deviation = 6.13
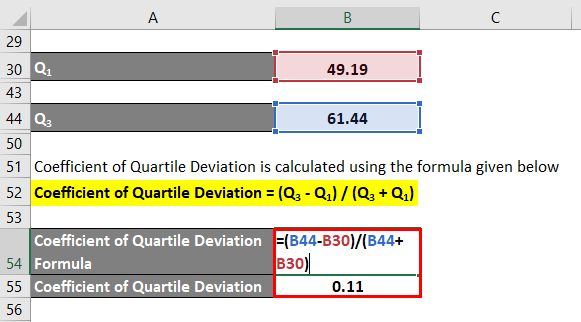
The formula to calculate the Coefficient of Quartile Deviation is as below:
Coefficient of Quartile Deviation = (Q3 – Q1) / (Q3 + Q1)
- Coefficient of Quartile Deviation = (61.44 – 49.19) / (61.44 + 49.19)
- Coefficient of Quartile Deviation = 12.25 / 110.63
- Coefficient of Quartile Deviation = 0.11
Explanation
Quartile deviation is the dispersion in the middle of the data where. It defines the spread of the data. We know that the difference between the Third Quartiles and First Quartiles is called the Interquartile range, and half of the Interquartile Range is called Semi-Interquartile, also known as the Quartile deviation. Now, we can calculate the quartile deviation for both grouped and ungrouped data using the formula below.
Quartile Deviation = (Third Quartile – First Quartile) / 2
Quartile Deviation =(Q3 – Q1) / 2
While the coefficient of quartile deviation is used to compare the variation between two data sets.6687 Moreover, quartile deviation is not affected by the extreme values where it contains extreme values. A Coefficient of Quartile deviation can be calculated in such a fashion.
Coefficient of Quartile Deviation = (Q3 – Q1) / (Q3 + Q1)
The concept of quartile deviation and coefficient of quartile can be explained with the help of an example in a definite set of steps.
Step 1: Obtain a set of Ungrouped data
In the problem statement, we have considered runs scored by a batsman in the last 20 test matches: 96, 70,100, 89,78,56,45,78,68,42,66,89,90,54,44,67,87,90,97, and 98
Step 2: Arrange the data in ascending order:
42,44,45,54,56,66,67,68,70,78,78,87,89,89,90,92,96,97,98,100
First Quartile(Q1)
Calculate the first quartile
Qi= i * (n+1) /4th observation
- Q1 = 1 * (20 + 1) /4 th observation
- Q1 = 5.25th observation
So, 5.25th observation lies between the 5th and 6th value in the ordered group, or midways between 55 & 66 therefore
- Q1= 55 + 0.25 * (66 – 55)
- Q1 = 55 + 2.75
- Q1= 57.25
Third Quartile (Q3)
The calculation of the third Quartile is given as follows:
Qi= i * (n+1) /4th observation
- Q3 = i * (n+1) /4
- Q3 = 3 * (20 + 1) /4th observation
- Q3 = 15.75th observation
Where 15.75th lies between the 15th and 16th value in the ordered group
15th observation = 90
16th observation = 96
- Q3 = 90 +0.75 * (96 – 90)
- Q3 = 90 + 4.5
- Q3 = 94.5
Step 3: Calculate the Quartile Deviation & Coefficient of Quartile Deviation based on the respective outcome.
Quartile Deviation =(Q3 – Q1) / 2
- Quartile Deviation = (94.5 – 57.25) / 2
- Quartile Deviation = 18.625
Coefficient of Quartile Deviation = (Q3 – Q1) / (Q3 + Q1)
- Coefficient of Quartile Deviation = (94.5 – 57.25) / (94.5 +57.25)
- Coefficient of Quartile Deviation = 0.2454
Relevance and Uses of Quartile Deviation Formula
- The Quartile Deviation doesn’t consider much more extreme points of the distribution.
- QD also changes with respect to the change of scale of data.
- It is the best measure for the open-ended system.
- Less affected by the sampling fluctuations in the dataset
- Solely depend on the central values in the distribution.
Quartile Deviation Formula Calculator
You can use the following Quartile Deviation Formula Calculator
| Q3 | |
| Q1 | |
| Quartile Deviation | |
| Quartile Deviation = |
|
|
Recommended Articles
This is a guide to Quartile Deviation Formula. Here we discuss how to calculate Quartile Deviation Formula along with practical examples. We also provide a Quartile Deviation calculator with a downloadable Excel template. You may also look at the following articles to learn more –
