Updated August 23, 2023
QUARTILE in Excel
Quartile denotes 4 equal portions from the same group or population. In Excel, with the help of the Quartile function, we can find to what extent the portion from the group will start. For example, if in a group of 4 numbers starting from 1 to 4 if want to know at what point 2nd quarter or portion will start. This would be a Quartile value from the selected population.
Uses of QUARTILE Function:
The QUARTILE Function returns the quartile for a given set of data. This function divides the data set into four equal groups. QUARTILE will return the minimum, first, second, third, and maximum values.
The QUARTILE Function is a built-in function in excel, and it falls under the Statistical functions category. This function is also known as a Worksheet function in Excel. As a worksheet function, this function can be used as a part of the formula in a worksheet cell.
QUARTILE Formula in Excel:
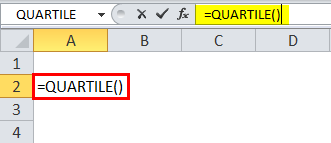
Below is the QUARTILE Formula:
Where the supplied arguments are:
- Array – It is the array or cell range of numerical values for which we want the quartile value.
- Quart – The Quartile value to return.
The Quartile function in Excel accepts 5 values as Quart( Second argument), which is shown in the below table:
|
QUART Value |
Return Value |
| 0 | Minimum Value |
| 1 | First Quartile – 25th percentile |
| 2 | Second Quartile – 50th percentile |
| 3 | Third Quartile – 75th percentile |
| 4 | Maximum Value |
As a Worksheet function in excel, the QUARTILE function can be used as part of a formula like below:
Where is QUARTILE Function Found in Excel?
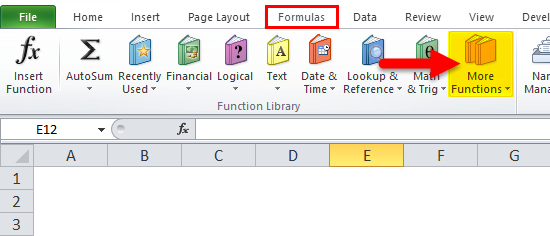
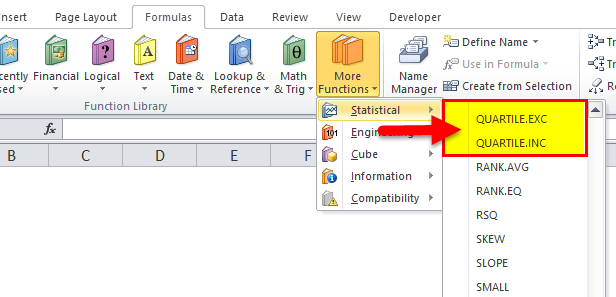
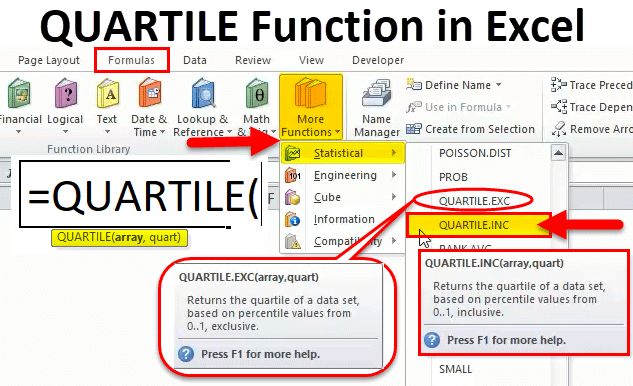
The QUARTILE Function is a built-in function in excel; hence it is found under the FORMULAS tab. Please follow the below steps:
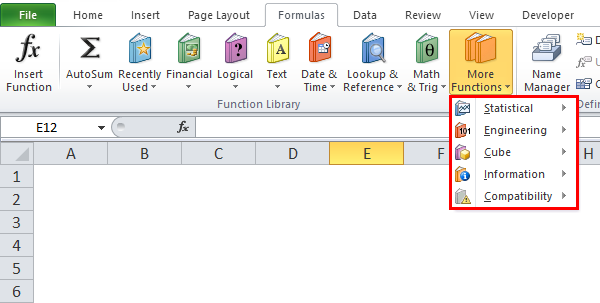
- Click on the FORMULAS tab. Click on the More Functions option.
- It will open a drop-down list of functions categories.
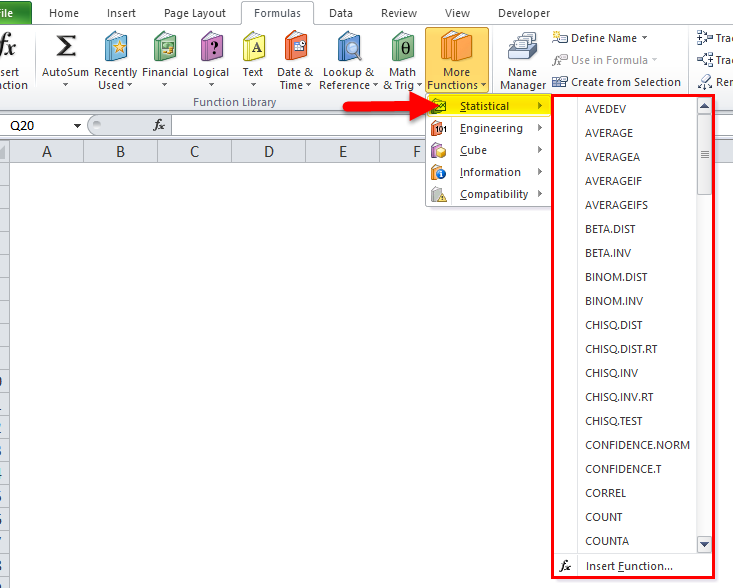
- Click on the Statistical Functions category. It will open a drop-down list of functions.
- Select the QUARTILE Function from the drop-down list.
- In the above screenshot, as we can see, there are two functions listed with the name of QUARTILE:
- QUARTILE.EXC
- QUARTILE.INC
In the new version of excel, the QUARTILE function has been replaced with these two functions, giving more accuracy in the result.
However, in excel, the QUARTILE function is still available, but it might be replaced in future with these functions at any time.
How to Use QUARTILE Function in Excel?
QUARTILE Function is very simple to use. Let us now see how to use the TILE function in Excel with the help of some examples.
Example #1
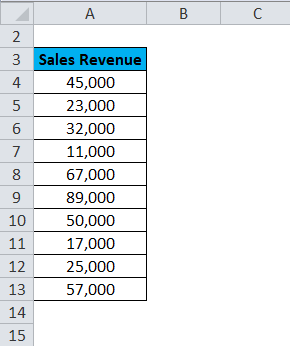
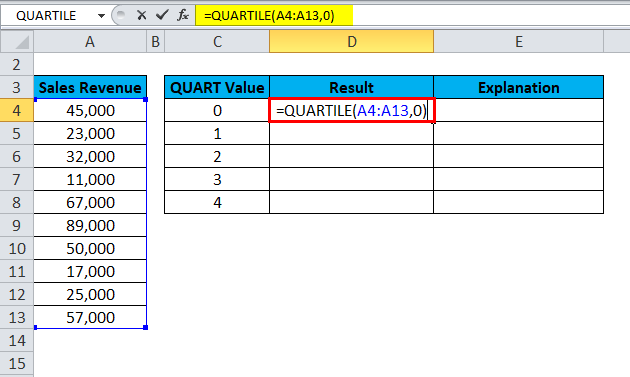
We have given some sales figures:
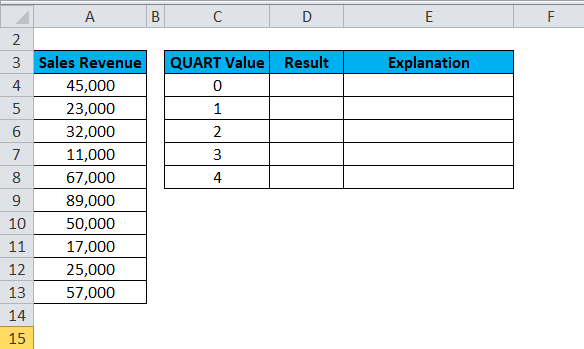
Here, we will calculate the minimum value, First Quartile, Second Quartile, Third Quartile, and Maximum value by using the QUARTILE Function. We will take the value of the second argument QUART from 0-4 of the QUARTILE function like the below screenshot for this calculation.
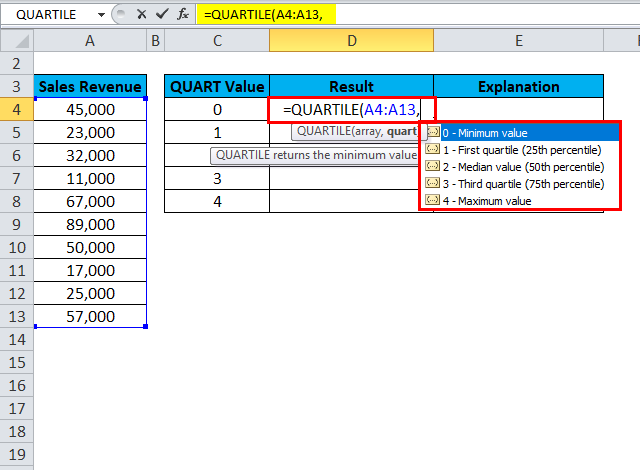
Now we will apply the QUARTILE function to the sales data.
We will calculate the QUARTILE function for all values one by one by selecting the values from a drop-down list.
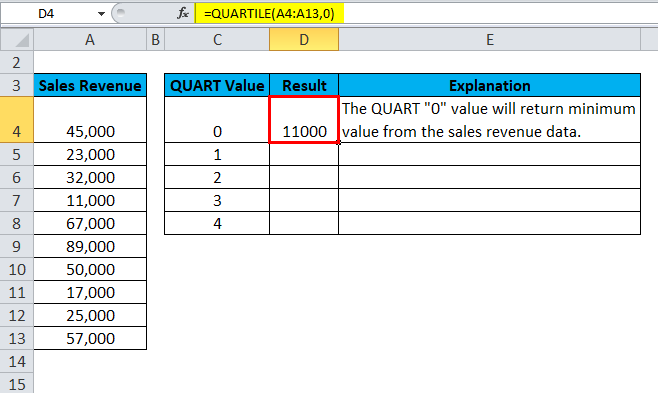
The Result is:
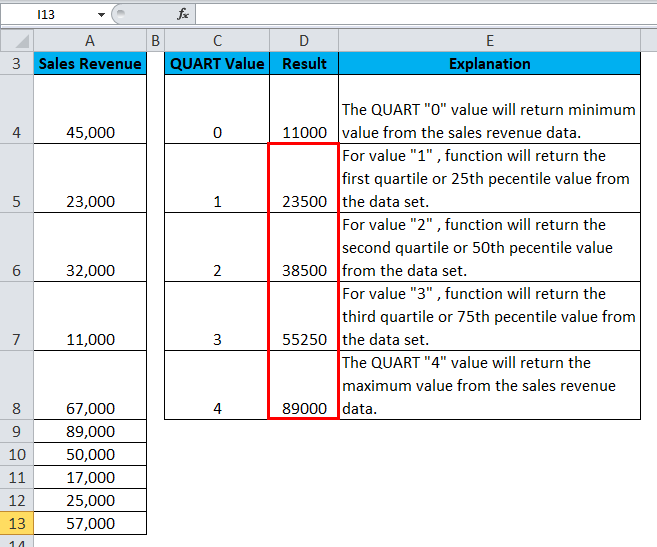
Similarly, we will find other values. The final result is shown below:
Explanation:
- Pass the array or cell range of data values for which you need to calculate the QUARTILE function.
- Pass the value 0 as the second argument to calculate the minimum value of the given data set.
- Enter the value 1 for the first quartile.
- Enter the value 2 for the second quartile.
- Enter the value 3 for the third quartile.
- Enter the value 4 as the second argument, which will give the maximum value of the data set.
Example #2
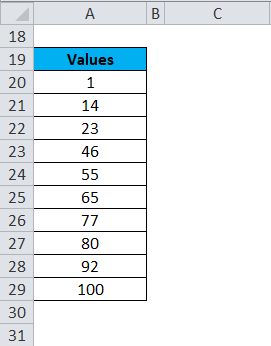
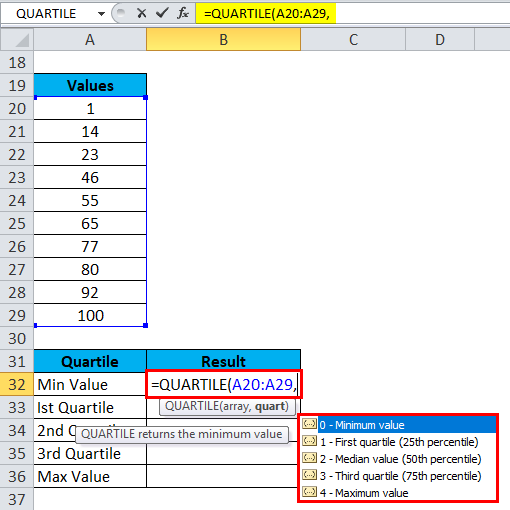
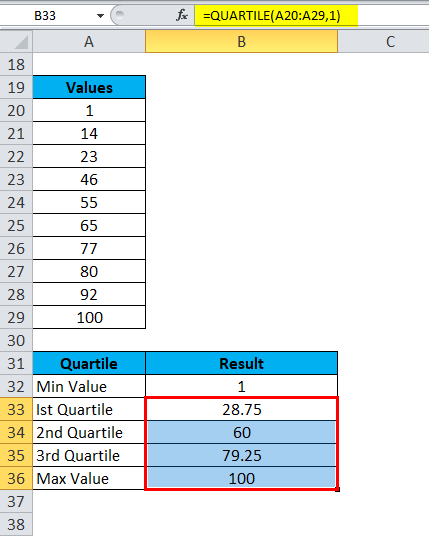
Let’s take another data set in which data is arranged in ascending order for better understanding the use of the Excel QUARTILE function:
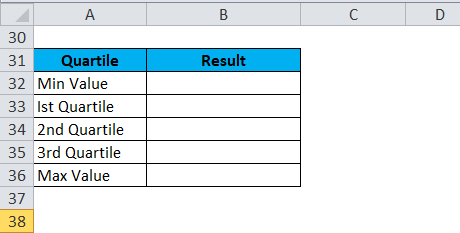
Now will calculate the below quartile values:
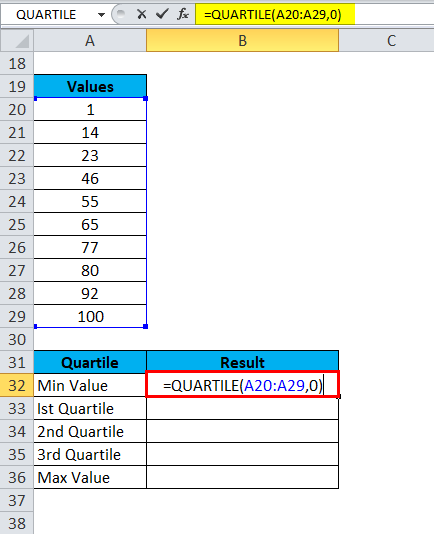
The formula is shown as below:
We will calculate the QUARTILE function for all values one by one by selecting the values from a drop-down list.
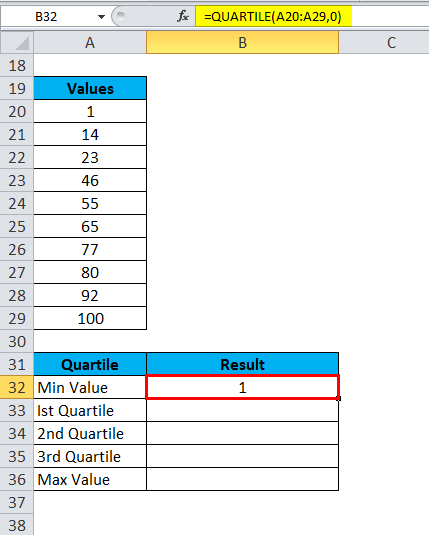
The Result is:
Similarly, we will find other values. The final result is shown below:
Explanation:
- If we see the result closely, 1 is the minimum value from the given data set.
- 100 is the maximum value from the data set.
- 1st quartile value is 28.75, 2nd quartile value is 60, and 3rd quartile value is 79.25.
- The QUARTILE function divides the data set into 4 equal parts. This means we can say that 25% of the values fall between a minimum value and 1st
- 25% values lie between 1st and 2nd
- 25% values lie between 2nd and 3rd
- 25% values lie between the 3rd and maximum values.
Now we will learn the use of QUARTILE.EXC and QUARTILE.INC functions as in future the QUARTILE function can be replaced by these functions.
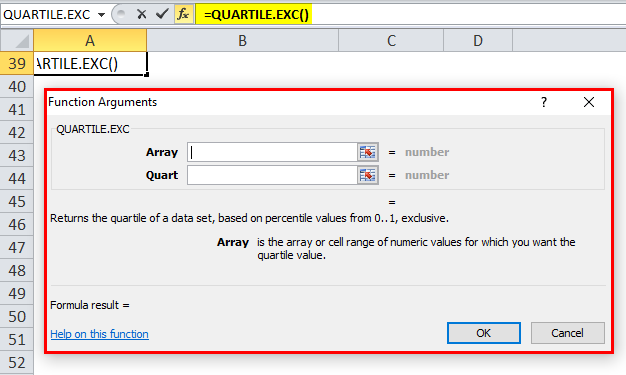
The SYNTAX of QUARTILE.EXC and QUARTILE.INC is the same. If we select QUARTILE.EXC function from the Statistical functions category drop-down list of function, it will open a dialog box for Function arguments.
The Passing arguments are the same as the QUARTILE function.
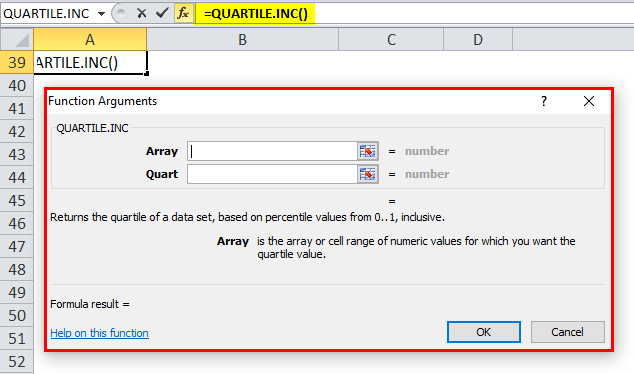
If we select QUARTILE.INC function, it will also open a dialog box for function arguments as shown below:
The QUARTILE.INC function returns the quartile of a data set, based on percentile values from 0..1, inclusive. Whereas the QUARTILE.EXC function returns the quartile of a data set, based on percentile values from 0..1, exclusive.
Now in the below examples, we will see the difference between the above two functions.
Example #3
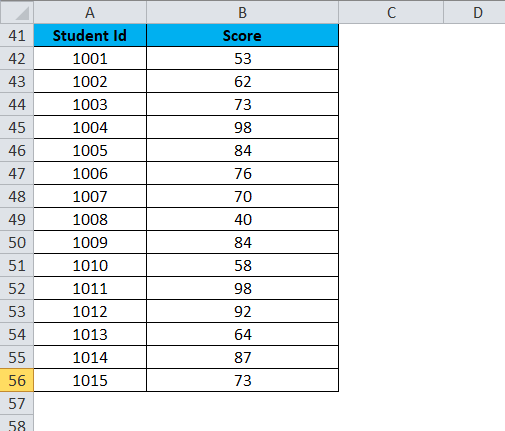
Let’s assume the below test scores of a class.
We will apply the QUARTILE.EXC and QUARTILE.INC functions on the above scores and will observe the result of these functions closely.
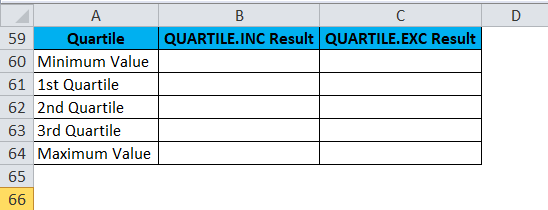
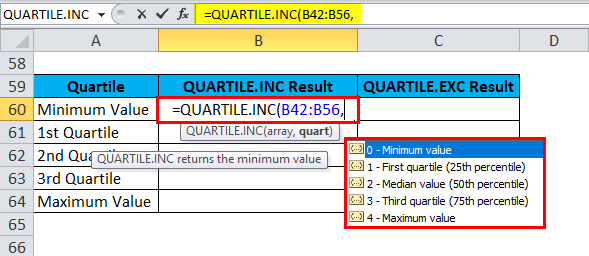
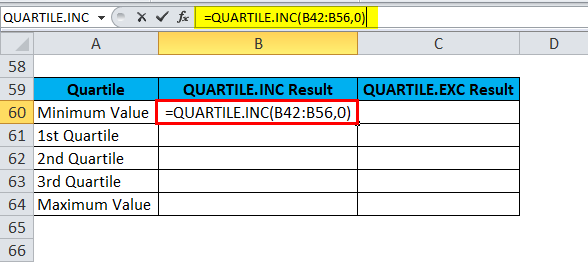
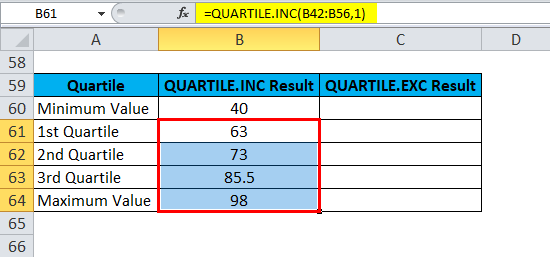
First, we are calculating the QUARTILE.INC function. Pass the list of scores as the first argument of the function and choose the second argument from the list 0-4 for a min, 1st, 2nd, 3rd, and max values one by one as shown below:
We will calculate the QUARTILE function for all values one by one by selecting the values from a drop-down list.
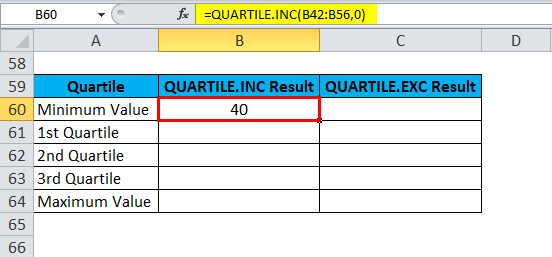
The Result is:
Similarly, we will find other values. The final result is shown below:
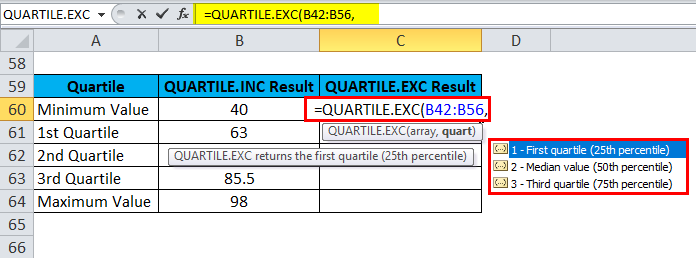
The same steps will follow for calculating the QUARTILE.EXC function.
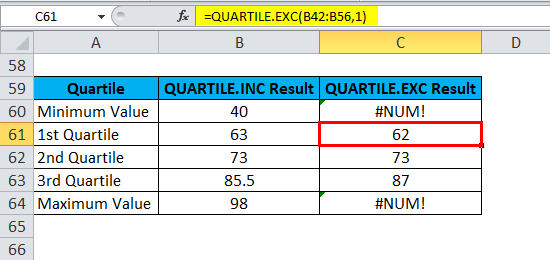
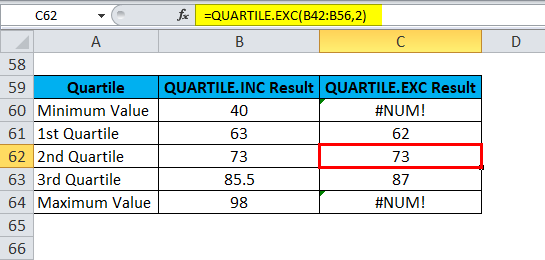
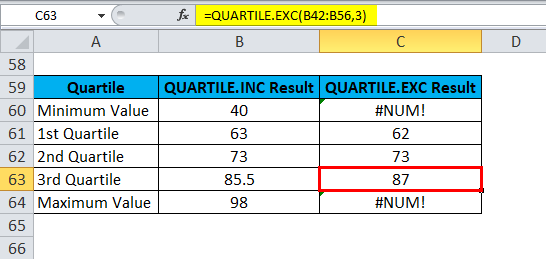
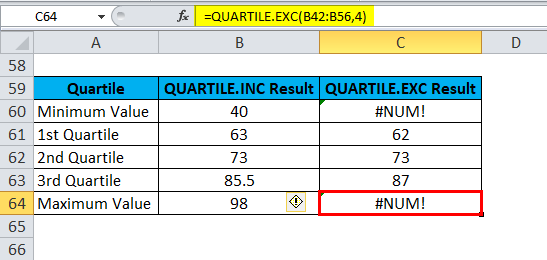
QUARTILE.EXC function 1st, 2nd and 3rd quartile values.
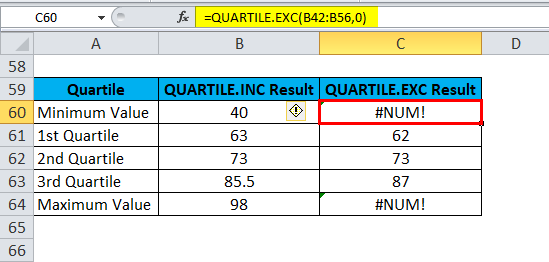
The Result is :
Explanation:
- Suppose you see the above results for values 0 and 4, the QUARTILE.EXC function returns the #NUM! an error value because it calculates only 1st, 2nd and 3rd quartile values. Whereas the QUARTILE.INC function works like same as the QUARTILE function.
- The 2nd quartile value is the same for both functions.
- The 1st quartile value of QUARTILE.EXC will be a little less than the QUARTILE.INC.
- The 3rd quartile value of QUARTILE.EXC will be a little higher than the QUARTILE.INC.
Things to Remember
- QUARTILE Function divides the dataset into 4 equal parts.
- We can say that 25% values lie between Min and 1st Quartile, 1st and 2nd Quartile, 2nd and 3rd Quartile and 3rd & maximum value.
- Suppose the function returns #VALUE! error – means the second parameter QUART of the function is non-numeric.
- If the function returns #NUM! error, i.e.
- The given array is empty.
- The value of Quart is less than 0 or greater than 4.
Recommended Articles
This has been a guide to the Excel QUARTILE function. Here we discuss the QUARTILE Formula and how to use QUARTILE Function in Excel, with practical examples and a downloadable Excel template. You can also go through our other suggested articles –

