Updated September 28, 2023
Definition
Regression in Data Mining involves using statistical methods to examine the connection between a dependent variable and multiple independent variables. The objective of this is to cultivate a model that could forecast the exact value of the dependent variable based on the defined values of the independent variables. It is often used to predict numerical outcomes such as a house’s price or a product’s sales. Regression analysis aims to identify the most important relationships among variables and use these relationships to make predictions.
Key Takeaways
- Regression analysis is a predictive modeling technique
- Used to forecast numerical outcomes such as sales, prices, etc.
- Helps identify important factors affecting the dependent variable
- Develops a mathematical equation to make predictions based on input variables.
What is Regression in Data Mining?
Regression is a valuable tool for making predictions, understanding relationships between variables, and testing hypotheses about cause-and-effect relationships. In Data Mining, regression models are developed using past data and can be utilized to make predictions for new data. In addition to prediction, regression analysis helps identify the most significant variables affecting the dependent variable and develop a mathematical equation to describe the relationship between the variables.
Regression analysis in data mining entails using statistical techniques to assess the correlation between a dependent variable and distinct, independent variables. The aim is to make predictions by understanding the influence on the dependent variables due to the changes in the independent variables. The ultimate goal is to forecast future results based on this knowledge. This technique is frequently employed in data mining for predicting numerical results, such as sales figures, prices, and others, and is constructed using historical data. The regression model can be utilized to generate predictions based on new input information.
Types of Regression
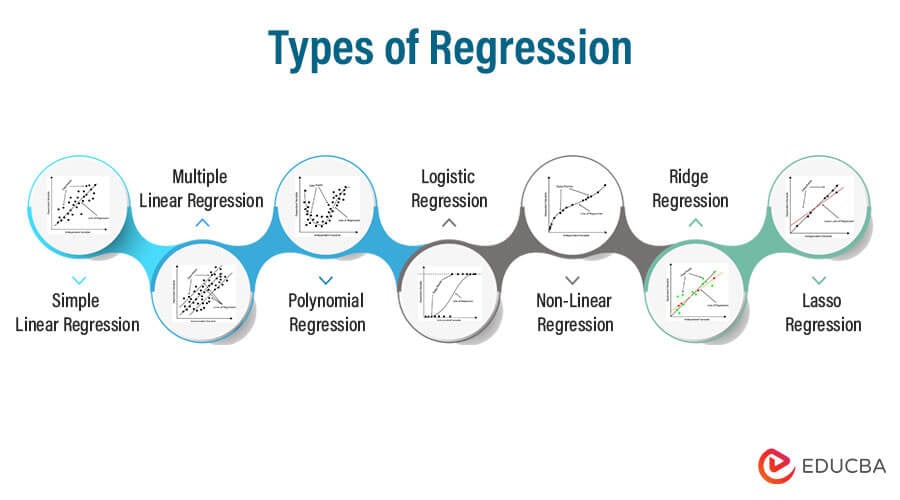
Regression analysis techniques come in various forms, and the application of each technique relies on a number of factors. Let’s look at a few types.
1. Simple Linear Regression
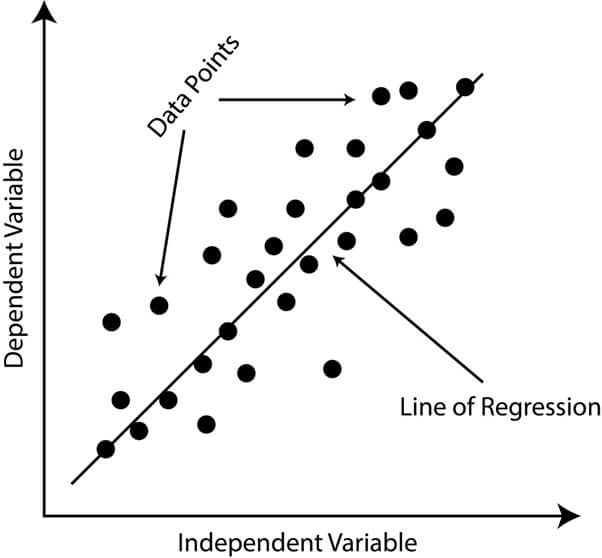
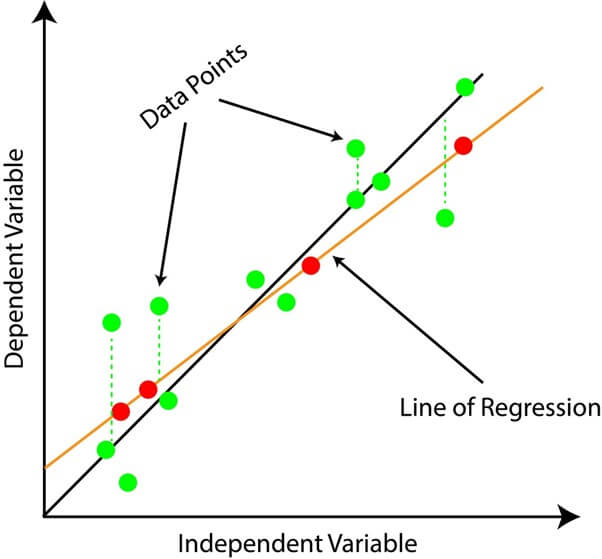
A statistical approach analyzes the connection between two variables, with one being classified as dependent and the other as independent. Simple linear regression’s foremost objective is to find the optimal line that expresses the relationship between the dependent and independent variables. The appropriate line is decided using the least squares method, decreasing the sum of the squared differences between the observed and predicted values.
- A simple linear regression is represented as an equation
- Where Y the dependent variable and X being the independent variable, β0 the intercept term, and β1 is the slope term.
- The intercept term represents the value of Y when X = 0, and the slope term represents the change in Y for a unit change in X. (In statistics, the symbol β represents the parameters or coefficients in a regression model.)
2. Multiple Linear Regression
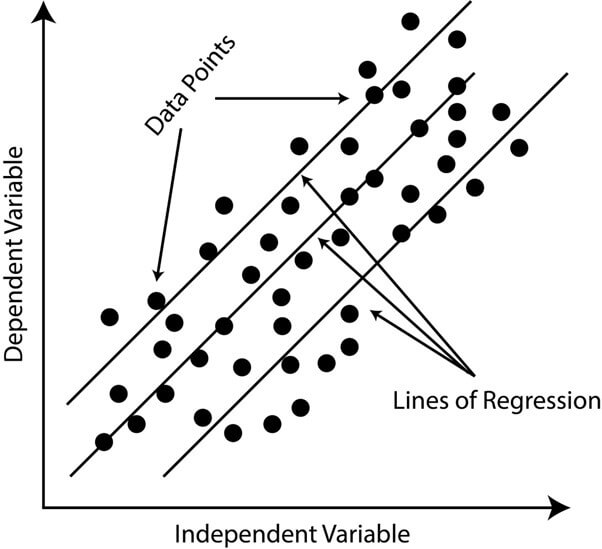
A statistical approach that investigates the interrelation between many independent variables and a dependent variable. The goal is to process a mathematical model expounding the relation between the dependent and independent variables.
- The model is represented by an equation of the form:
- Where the dependent variable is Y, X1, X2, … Xp are the independent variables, β0 is the intercept term, and β1, β2, … βp are the coefficients that represent the effect of each independent variable on the dependent variable.
- These coefficients that are in the multiple linear regression equation are estimated using historical data, and the goal is to find the values of β that minimize the difference between the observed values and the values predicted by the model. Finally, when the coefficient values have been estimated, the model can be utilized for predictions about the dependent variable based on the values of the independent variables.
3. Polynomial Regression
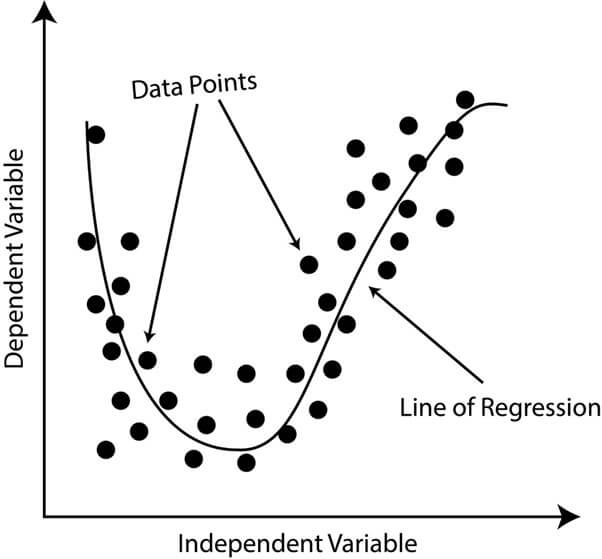
A form of regression analysis that portrays the association between the independent variable and the dependent variable as a polynomial of degree n. This does suggest that the dependent variable is displayed as a polynomial function of one or more independent variables. For example, consider a situation where the correlation of the independent variable (x) and the dependent variable (y) is quadratic in nature.
- The polynomial regression model for this relationship would be:
- Where β0, β1, and β2 are the coefficients of the polynomial equation that need to be estimated from the data. Once these coefficients have been estimated, the polynomial regression model can be used to make predictions for new values of x.
4. Logistic Regression
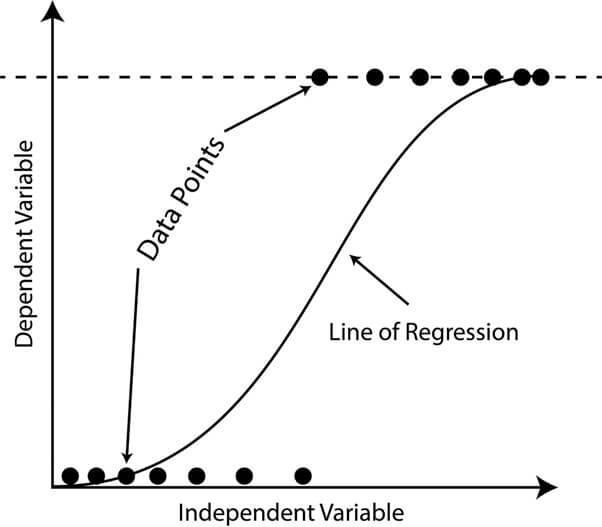
A statistical technique used for solving binary classification problems, with the aim of predicting a binary result (e.g., true/false, yes/no). The result is shaped as the function of the independent variables utilizing a logistic function (a.k.a. sigmoid function), which gives a value between 0 and 1 that can be comprehended as the probability of the positive class.
- For example, consider a scenario where a bank wants to predict the likelihood of a customer defaulting on a loan.
- The bank has been collecting data on customers’ income, credit history, and related details.
- Here the dependent variable is the binary outcome (default or no default), and the independent variables are the customers’ credit history, income, and other relevant information.
- Logistic regression can be used to model the relationship between these independent variables and the binary dependent variable, allowing the bank to predict the probability of a consumer defaulting on a loan.
5. Non-Linear Regression
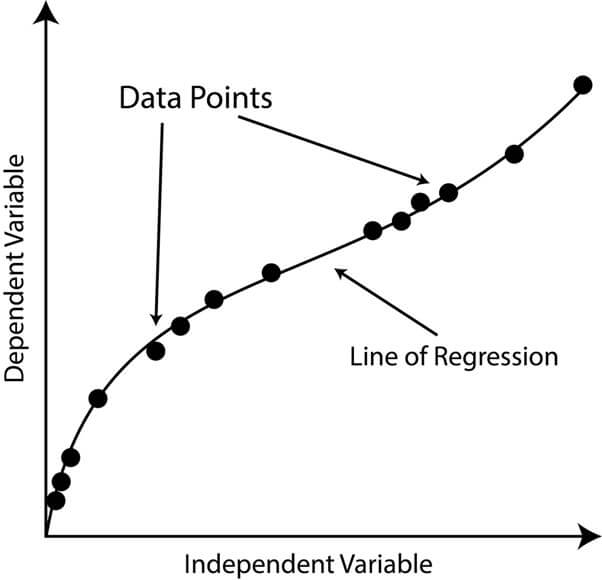
A form of regression analysis that portrays the correlation of the independent and dependent variables as a non-linear equation. Unlike linear regression, where the relationship between the variables is modeled as a straight line, non-linear regression allows for more complex and flexible relationships between variables to be modeled.
- For example, let’s take a scenario where the relation between the height and weight of a person is being analyzed.
- In this type of linear regression model, height and weight are compared as a straight line, but this may not accurately capture the relationship in reality.
- In a non-linear regression model, the relationship between height and weight can be modeled as a curve, providing a better fit to the data and a more accurate representation of the underlying relationship.
6. Ridge Regression
A form of regression analysis that discourages excessive coefficients in the regression equation, thereby mitigating the threat of overfitting. In multicollinearity, the independent variables are highly correlated, and this can cause unstable regression coefficients, making the predictions unreliable. Ridge Regression addresses this issue by adding a penalty term to the regression equation that discourages the coefficients from becoming too large.
The penalty term is a parameter that controls the amount of shrinkage that occurs. A larger penalty term results in smaller regression coefficients and a more robust regression equation. The aim of Ridge Regression is to balance the trade-off between finding a good fit for the data and avoiding overfitting.
- Let’s take an example of Ridge Regression, which would predict the rate of a house based on its location, size, and various features.
- In this case, the size of the house and its location may be highly correlated, leading to unstable regression coefficients.
- By using Ridge Regression, the model can account for this correlation and produce more reliable predictions.
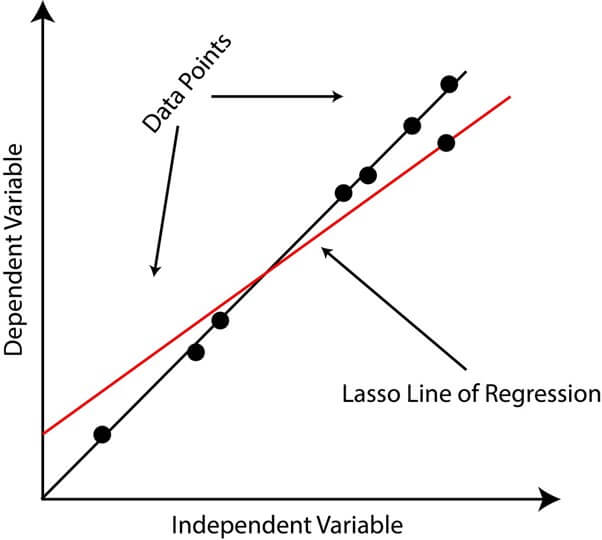
7. Lasso Regression (Least Absolute Shrinkage and Selection Operator)
A form of regression analysis that employs a shrinking parameter to minimize the magnitude of regression coefficients, resulting in sparse solutions. Unlike traditional linear regression, where all coefficients are estimated, Lasso Regression can set some coefficients to zero, effectively removing them from the model. This feature can be useful in reducing the risk of overfitting by reducing the complexity of the model and preventing the inclusion of redundant or irrelevant variables.
The Lasso penalty being a form of regularisation is a technique that is utilized to lessen the complexity of a model and avert overfitting. The Lasso penalty is calculated as the absolute value of the coefficients multiplied by a constant, known as the regularization parameter. The regularization parameter is a hyperparameter that must be selected using cross-validation or other methods.
- An example of Lasso Regression could be predicting the price of a house based on its size, number of rooms, location, and other factors.
- The aim of the model is to recognize the most important predictors of house price while also keeping the model simple and avoiding overfitting.
- Using Lasso Regression, some coefficients could be set to zero, effectively removing variables that are not useful for predicting house prices.
Uses of Regression in Data Mining
- Predictive Modeling: Regression is commonly used to predict numerical outcomes, such as sales figures, stock prices, and consumer behavior.
- Variable Selection: Regression analysis can help identify the most significant variables affecting a dependent variable and to develop a mathematical equation that describes the relationship between the variables.
- Hypothesis Evaluation: Regression analysis can be employed to evaluate assumptions about cause-and-effect associations between variables.
- Trend Analysis: Regression can be used to analyze trends in data over time and to make predictions about future trends.
- Outlier Detection: Regression analysis can help identify outliers or data points that deviate significantly from the overall trend and assess the impact of these outliers on the model.
- Model Selection: Regression can be used to compare different models and to select the best model based on performance metrics, such as accuracy and precision.
- Data Visualization: Regression models can be used to create visual representations of data, such as scatter plots, line graphs, and heat maps, making it easier to understand complex data relationships.
Differences between Regression and Classification in Data Mining
Regression and classification are two important techniques in data mining with distinct differences.
| Feature | Regression | Classification |
| Output | Regression is utilized to speculate continuous numerical values | Classification is used to forecast categorical values. |
| Evaluation Metrics | Mean Squared Error (MSE) and R-Squared are frequent evaluation metrics for Regression. | Accuracy, precision, recall, and F1 score are generally employed as the evaluation metrics for classification. |
| Model Selection | In Regression, the prime model is chosen based on the lowest MSE or highest R-Squared. | In classification, the selected model is based on the highest accuracy or the best trade-off between precision and recall. |
| Overfitting | In Regression, overfitting is commonly prevented by regularization | In classification, it is generally prevented by cross-validation |
| Algorithms | Some algorithms in Regression are Linear Regression, Polynomial Regression, Logistic Regression, etc. | Some algorithms in Classification are Decision Trees, Random Forests, Neural Networks, etc. |
Conclusion
Hence, Regression is used in data mining to model the relation between the dependent variable and multiple independent variables for making predictions. It is mainly used for predictive modeling, hypothesis testing, and trend analysis. The type of regression technique used depends on the problem and data that is being analyzed.
Recommended Article
We hope that this EDUCBA information on “Regression in Data Mining Definition” was beneficial to you. You can view EDUCBA’s recommended articles for more information.
