Difference Between Regression vs ANOVA
Regression analysis and ANOVA analysis are two methodologies widely used in statistics and are two sides of the same coin. ANOVA term refers to an analysis of variance while regression is a statistical tool. It is very difficult to distinguish between regression vs ANOVA as they are often used interchangeably and are applicable only when there is a continuous outcome variable. In this regression vs ANOVA article, we will try and understand the difference between the two and their nature and scope of work in detail.
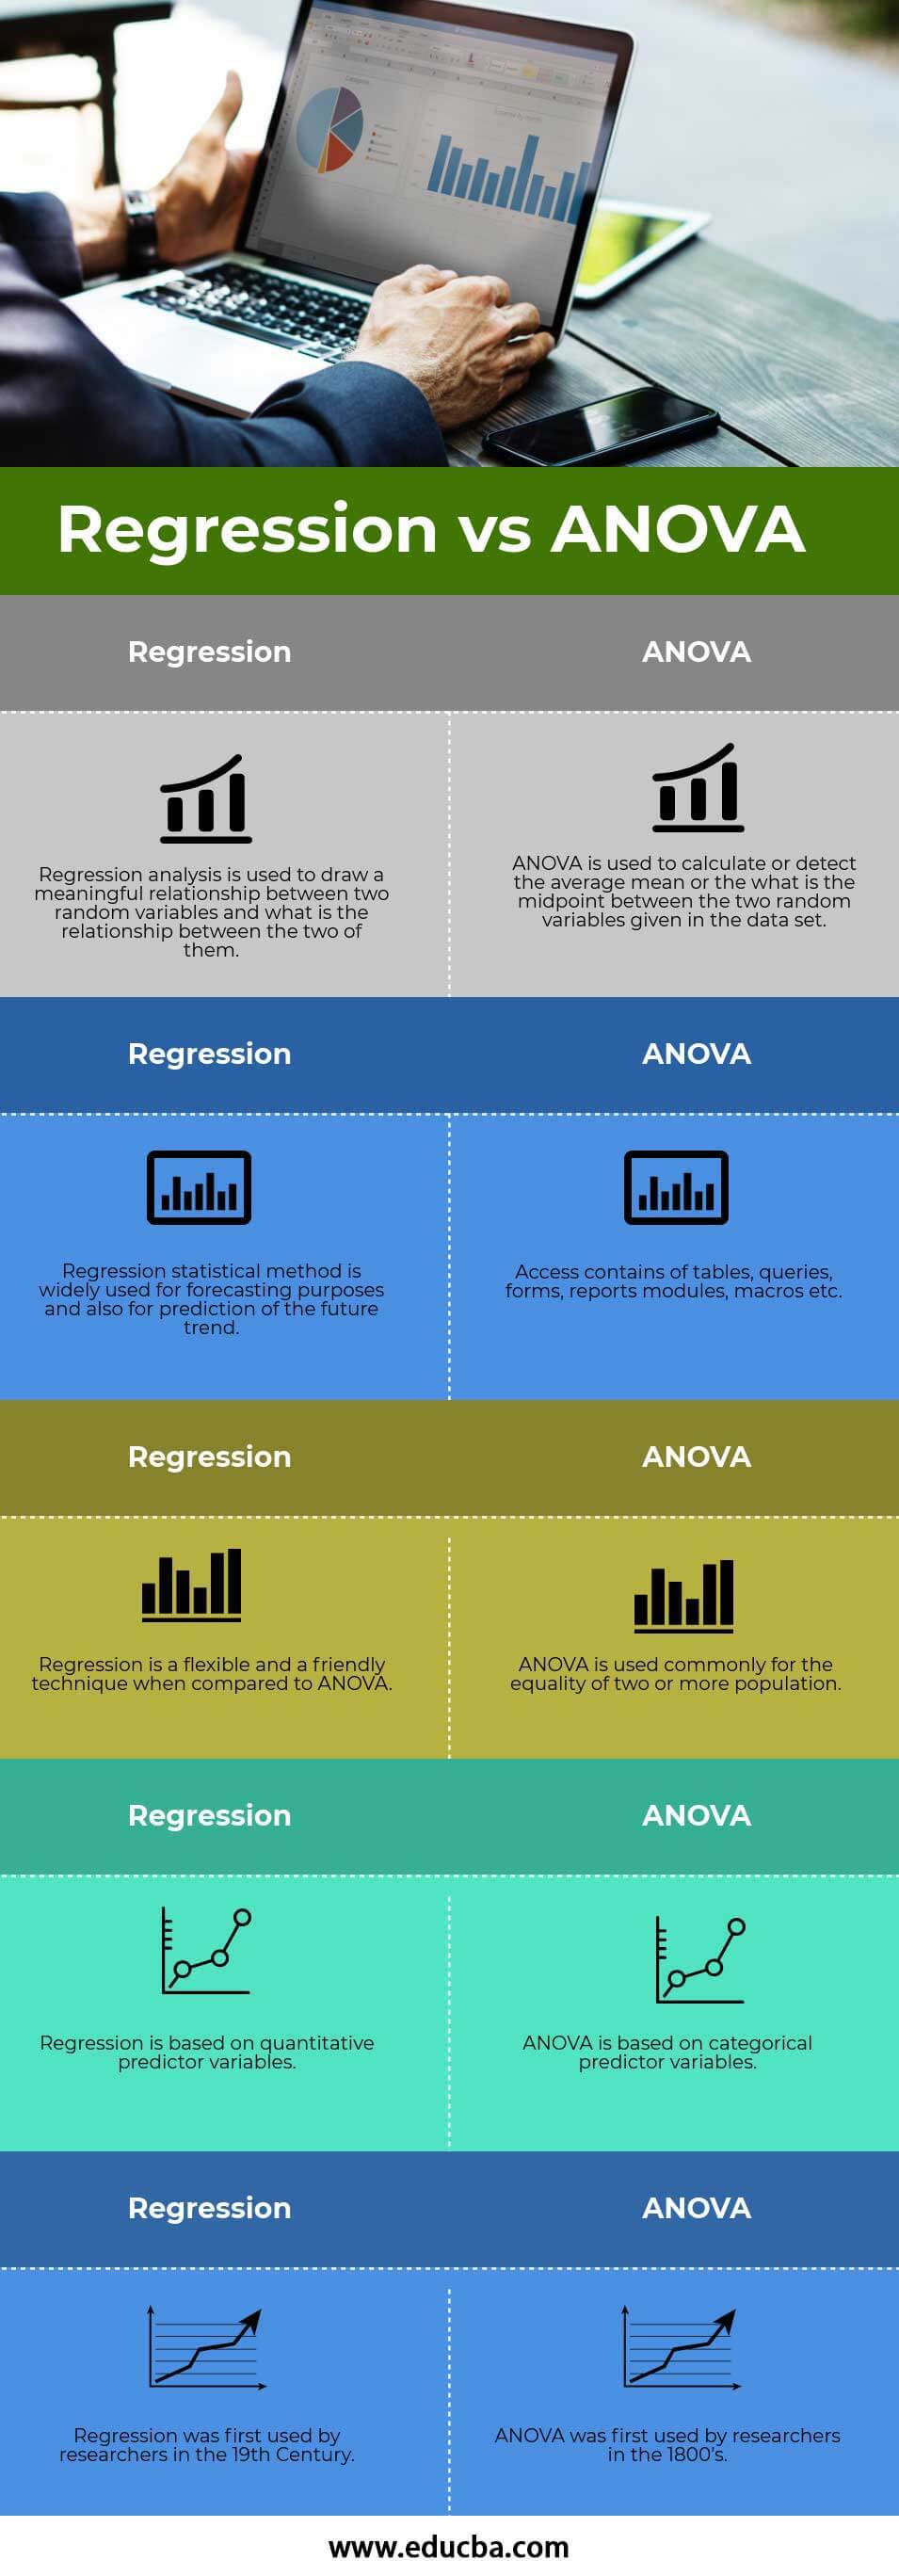
Head to Head Comparison Between Regression and ANOVA (Infographics)
Below is the top 5 difference between Regression and ANOVA:
Key Differences Between Regression and ANOVA
Both Regression vs ANOVA are popular choices in the market; let us discuss some of the major difference between Regression and ANOVA:
- ANOVA is used as a tool to define the quantity of delta is the residual variance is reduced by the predictors in the model. Whereas, on the other hand of the spectrum Regression analysis is used to analyze what is the change in the response expected when the predictor value has been changed by a given amount. Although ANOVA can also be applied to the regression model
- Regression focuses on the working of an independent or continuous variable. There exists only one single error term in regression. On the contrary, in ANOVA there can be several error terms involved
- ANOVA is used to determine the common average or the common mean. On the other hand regression analysis is mainly done to analyze the dependency of independent variables. The very first test of regression can be found in Legendre’s Book Method of Least Squares
- ANOVA comes with three models whereas regression comes with two models
- Regression is widely used for predicting and forecasting it also fits a least-squared line to data whereas, on the other hand, ANOVA helps in the sorting of data and finding averages in large data sets
- Regression is used to determine the relationship between a predictor and the response. On the other hand, ANOVA is used to judge what is the impact of a predictor or the complete set of predictors on the residual
- ANOVA is most commonly defined as a different or an alternative case of Regression but from the perspective of the users, there is a different flavor if the independent variable is categorical. You must use ANOVA otherwise the user should use regression analysis for better results and more in-depth analysis of the data
Regression and ANOVA Comparison Table
Below is the topmost comparison between Regression and ANOVA.
| Regression | ANOVA |
| Regression analysis is used to draw a meaningful relationship between two random variables and what is the relationship between the two of them | ANOVA is used to calculate or detect the average mean or the what is the midpoint between the two random variables given in the data set |
| It statistical method is widely used for forecasting purposes and also for prediction of the future trend | It is based on the logic of t-test that is drawing means from the sample data of two random variables |
| It is a flexible and friendly technique when compared to ANOVA | It is used commonly for the equality of two or more population |
| It is based on quantitative predictor variables | It is based on categorical predictor variables |
| It was first used by researchers in the 19th Century | It was first used by researchers in the 1800’s |
Conclusion
Both Regression vs ANOVA have more similarities than differences that is why it is difficult to comment on the differences between the two statistical methods. Both the method can often lead to different results on the same data when tested. These are the two methods in the statistical theory to analyze the behavior of one variable compared to another. However, both are renowned and are widely being used in the statistical world since the beginning of the research.
Recommended Articles
This has a been a guide to Regression vs ANOVA. Here we have discussed Regression vs ANOVA head to head comparison, key differences, along with infographics and comparison table. You may also have a look at the following articles to learn more–

