Updated July 28, 2023
Relative Standard Deviation Formula (Table of Contents)
- Relative Standard Deviation Formula
- Examples of Relative Standard Deviation Formula (With Excel Template)
- Relative Standard Deviation Formula Calculator
Relative Standard Deviation Formula
Standard Deviation helps us to understand the value of the Group data; the variance of each data from the Group average. There is data that is close to the group average and there is data whose value is high from the group average. Relative Standard deviation is the calculation of precision in data analysis.
Relative standard deviation is calculated by dividing the standard deviation of a group of values by the average of the values. RSD is being derived from Standard Deviation and with the help of different sets of data obtained from the current sample test done by the particular Research and Development team.
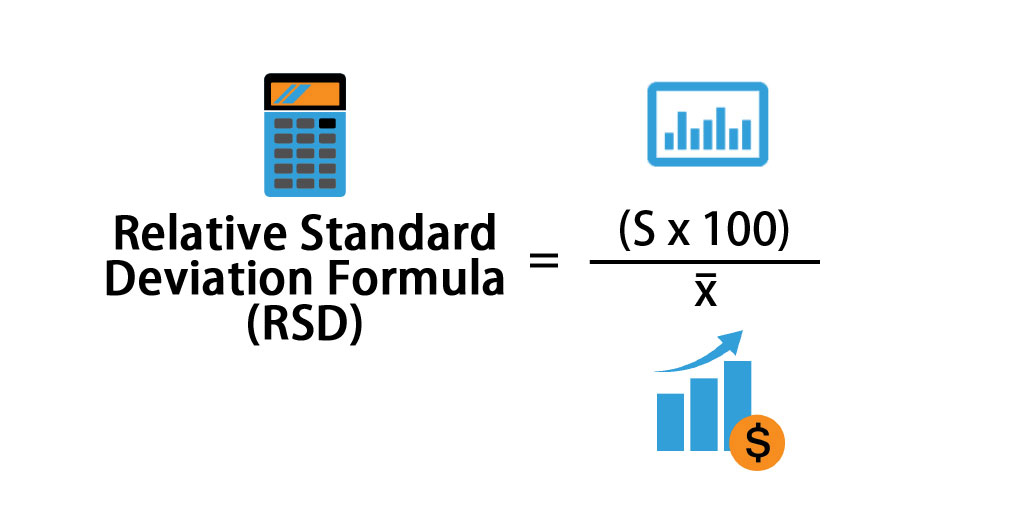
A formula for Relative Standard Deviation is
Where,
- RSD = Relative standard deviation
- S = Standard deviation
- x¯ = Mean of the data.
Examples of Relative Standard Deviation Formula (With Excel Template)
Let’s take an example to understand the calculation of Relative Standard Deviation in a better manner.
Relative Standard Deviation Formula – Example #1
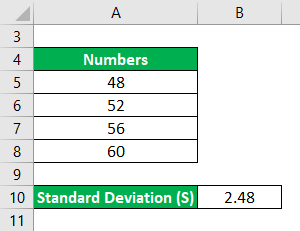
Calculate the Relative Standard Deviation for the following set of numbers: 48, 52, 56, 60 where the standard deviation is 2.48.
Solution:
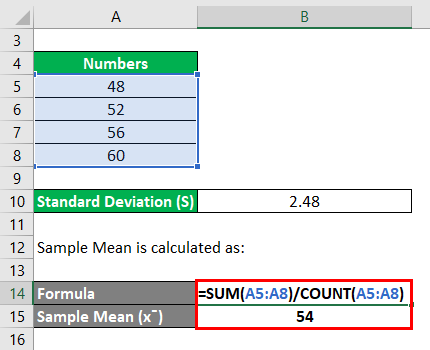
Sample Mean is calculated as:
- Sample Mean = (48+52+56+60) /4
- Sample Mean = 216/4
- Sample Mean = 54
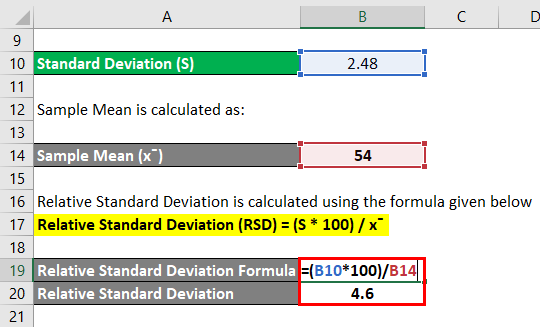
Relative Standard Deviation is calculated using the formula given below:
Relative Standard Deviation (RSD) = (S * 100) / x¯
- Relative Standard Deviation = (2.48 * 100) / 54
- Relative Standard Deviation = (248) / 54
- Relative Standard Deviation = 4.6
Thus, the RSD for the above number is 4.6.
Relative Standard Deviation Formula – Example #2
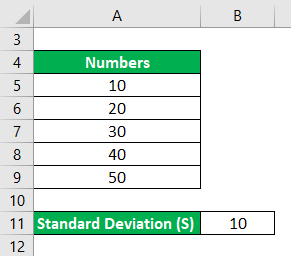
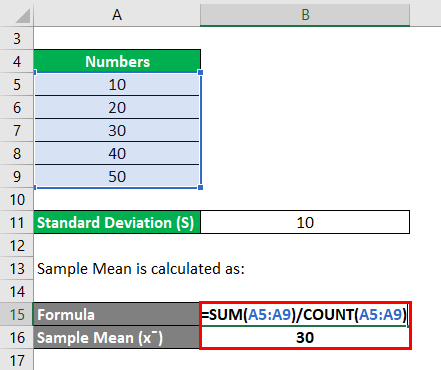
Calculate the Relative Standard Deviation for the following set of numbers: 10, 20, 30, 40, and 50 where the standard deviation is 10.
Solution:
Sample Mean is calculated as:
- Sample Mean = (10+20+30+40+50) /5
- Sample Mean = 150 / 5
- Sample Mean = 30
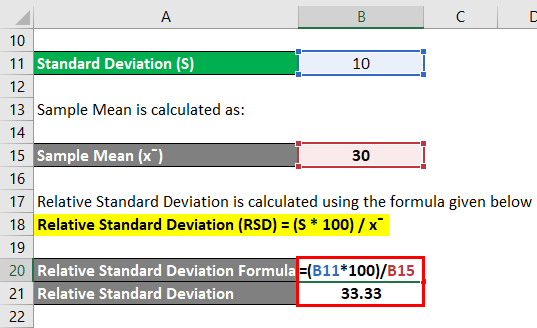
Relative Standard Deviation is calculated using the formula given below:
Relative Standard Deviation (RSD) = (S * 100) / x¯
- Relative Standard Deviation = (10 * 100) / 30
- Relative Standard Deviation = 1000 / 30
- Relative Standard Deviation = 33.33
Thus, the RSD for the above number is 33.33.
Relative Standard Deviation Formula – Example #3
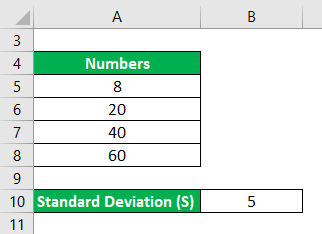
Calculate the Relative Standard Deviation for the following set of numbers: 8, 20, 40 and 60 where the standard deviation is 5.
Solution:
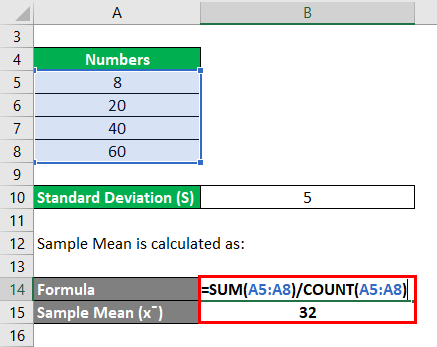
Sample Mean is calculated as:
- Sample Mean = (8+20+40+60) /4
- Sample Mean = 128 / 4
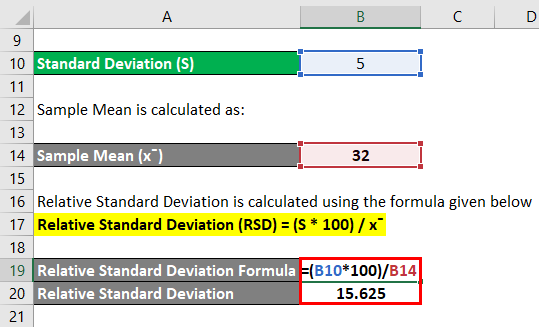
- Sample Mean = 32
Relative Standard Deviation is calculated using the formula given below
Relative Standard Deviation (RSD) = (S * 100) / x¯
- Relative Standard Deviation = (5 * 100) / 32
- Relative Standard Deviation = 500 / 32
- Relative Standard Deviation = 15.625
Thus, the RSD for the above number is 15.625.
Explanation
Relative Standard deviation is derived by multiplying Standard Deviation by 100 and dividing the result by a group’s average. It is expressed in percentage terms and it basically denotes how various numbers are placed in respect to the mean. It is commonly used for risk to return ratio across several investment proposals based out of its historical returns.
If the particular product appears to have a higher relative standard deviation, that means the numbers are very widely spread from its mean. Sometimes, as per product requirements, the RSD team needs certain data that are actually way far from the Average RSD. In those cases, Data that are well deviated from the RSD are taken into account.
In the case of the reverse situation i.e. lower relative standard deviation, the numbers are closer than their average and are also known as the coefficient of variation. It generally gives the idea of actual forecasts within the given set of data.
RSD indicates if the “regular” Standard Deviation is minimum or maximum in terms of quantity when compared to the mean from the series of data set. Regular standard deviation gives a fair idea about the distribution of scores around the mean (average). For example, with a mean score of 50 and a standard deviation of 10, most people would expect that most scores would lie in between 40 and 60 and that nearly all scores would fall between 30 and 70.
Relevance and Uses of Relative Standard Deviation Formula
- Relative Standard Deviation is widely used in interpreting the relation between statistical data at various segments. Statistics and Analytics has become the part and parcel of business houses and to forecast the expected demand of a particular data, a company is required to opt for different statistical tools. One of them is Relative Standard Formula which measures the probable demand at various stages based on historical statistical data and briefs about the expected production.
- In the case of any research-driven products, it’s not always possible to understand the exact outcome by the RSD team. Thus, the situations and the outcomes are led by huge uncertainties and probabilities. So, a conservative player would be to reach near the average. Thus, RSD eliminates the results which are too far in comparison with the actual RSD. The results which are closed to the RSD would be taken into account.
- This is one of the major tools which indicates if the stock price is moving across the growth of the Business or not. Sometimes the price movement of a particular stock is determined on the basis of the price movement of the index. If the price moves in the opposite direction then it can be detected with the help of RSD.
- There are various analytics and statistics that prevails in the world of investment followed by a return from a specific fund managed by different fund houses. Different returns from different fund houses indicate diversities and Investment dynamics. It is not always possible for a normal person to select the best funds. Thus, to streamline the particular fund according to his/her requirement, an ordinary man can approach RSD methods applied for Standard deviation.
- RSD is a refined form of Analytical tool that helps the end user to understand the trends, product demand, and expected customer preferences across the different industries. Thus to simplify the requirements, RSD helps to detect the actual results from different possibilities.
Relative Standard Deviation Formula Calculator
You can use the following Relative Standard Deviation Calculator
| S | |
| x¯ | |
| Relative Standard Deviation Formula (RSD) | |
| Relative Standard Deviation Formula (RSD) | = |
|
|
Recommended Articles
This is a guide to Relative Standard Deviation Formula. Here we have discussed how to calculate Relative Standard Deviation and practical examples. We have also provided a Relative Standard Deviation calculator with a downloadable excel template. You may also look at the following articles to learn more –
