Updated July 24, 2023

Definition of Return on Invested Capital?
The term “return on invested capital” or ROIC refers to the performance ratio that assesses the percentage return generated by a company by using its invested capital. In other words, ROIC helps in measuring how proficiently a company leverages each dollar of the invested money to produce dollars in net operating profit after tax.
ROIC is considered to be one of the best profitability indicators as it successfully overcomes the effect of capital structure and computes the return on the overall invested capital. The ROIC of a company can be compared with its weighted average cost of capital (WACC), and a higher value of ROIC than WACC indicates value creation, while a lower value means value destruction. WACC is the average cost of the mix of debt and equity funding.
The formula for ROIC can be derived by dividing net operating profit after tax (NOPAT) by the invested capital, which is then expressed as a percentage. It is defined as, mathematically.
Now, NOPAT can be expressed as the operating profit (EBIT) product and one minus the effective tax rate. Mathematically, it is represented as,
On the other hand, invested capital can be expressed as a summation of short-term debt, long-term debt, and shareholder’s equity minus cash & cash equivalent. Mathematically, it is represented as,
Example of Return on Invested Capital (With Excel Template)
Let’s take an example to understand the calculation of ROIC in a better manner.
Example #1
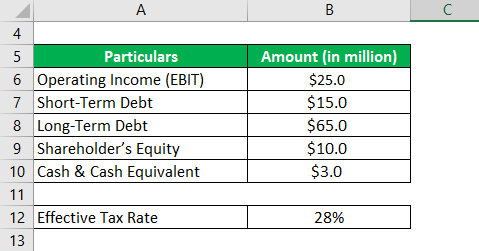
Let us take the example of a manufacturing company to illustrate the computation of ROIC. During 2018, the company booked an operating profit of $25.0 million, while short-term debt, long-term debt, shareholder’s equity, and cash & cash equivalent stood at $15.0 million, $65.0 million, $10.0 million, and $3.0 million, respectively as on balance sheet date. Calculate the company’s ROIC if the effective tax rate is 28%.
Solution:
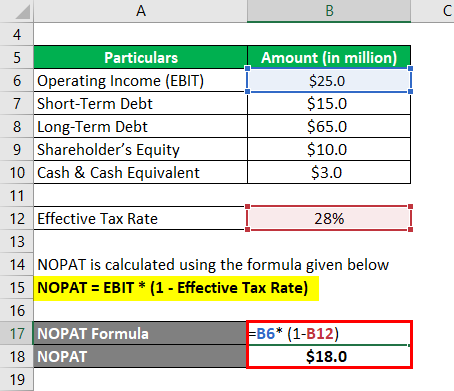
NOPAT is calculated using the formula given below
NOPAT = EBIT * (1 – Effective Tax Rate)
- NOPAT = $25.0 million * (1 – 28%)
- NOPAT = $18.0 million
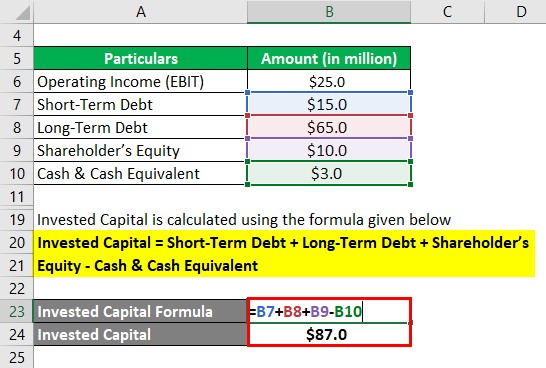
Invested Capital is calculated using the formula given below
Invested Capital = Short-term debt + Long-term debt + Shareholder’s Equity – Cash & cash Equivalent
- Invested Capital = $15.0 million + $65.0 million + $10.0 million – $3.0 million
- Invested Capital = $87.0 million
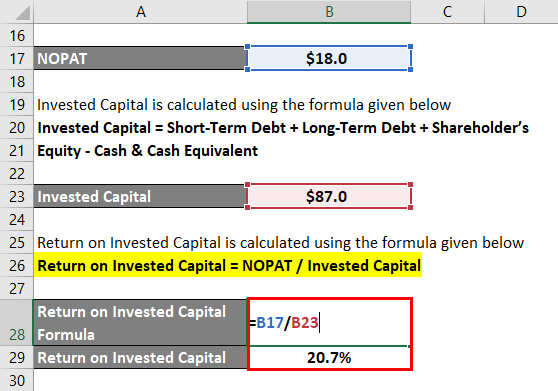
Return On Invested Capital for the year is calculated using the formula given below.
Return on Invested Capital = NOPAT / Invested Capital
- Return On Invested Capital = $18.0 million / $87.0 million
- Return On Invested Capital = 20.7%
Therefore, the company’s ROIC for the year 2018 was 20.7%.
Example #2
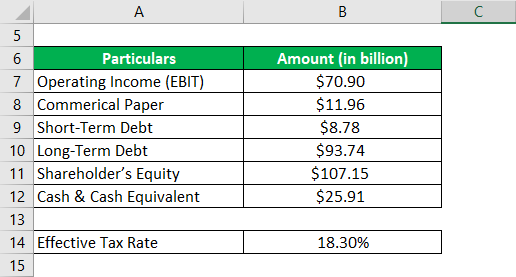
Let us take the example of Apple Inc. to illustrate the concept of ROICE. According to its annual report for 2018, the operating income was $70.90 billion, and commercial paper, short-term debt, long-term debt, shareholder’s equity, and cash & cash equivalent was $11.96 billion, $8.78 billion, $93.74 billion, $107.15 billion and $25.91 billion respectively as on September 29, 2018. Calculate Apple Inc.’s ROIC if the effective tax rate was 18.3%.
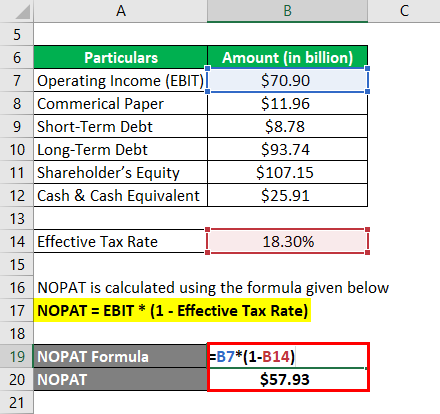
NOPAT is calculated using the formula given below
NOPAT = EBIT * (1 – Effective Tax Rate)
- NOPAT = $70.90 billion * (1 – 18.3%)
- NOPAT = $57.93 billion
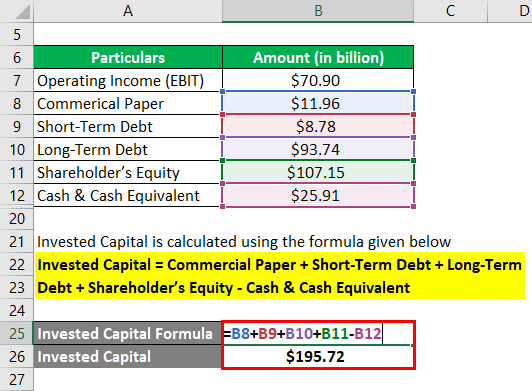
Invested Capital is calculated using the formula given below
Invested Capital = Commercial Paper + Short-Term Debt + Long-Term Debt + Shareholder’s Equity – Cash & Cash Equivalent
- Invested Capital = $11.96 billion + $8.78 billion + $93.74 billion + $107.15 billion – $25.91 billion
- Invested Capital = $195.72 billion
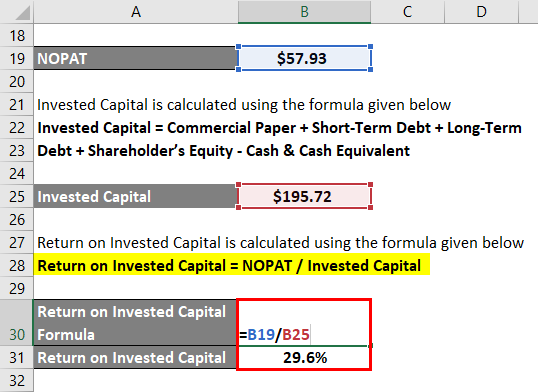
Return On Invested Capital for the year is calculated using the formula given below.
Return on Invested Capital = NOPAT / Invested Capital
- Return On Invested Capital = $57.93 billion / $195.72 billion
- Return On Invested Capital = 29.6%
Therefore, Apple Inc. managed ROIC of 29.6% during 2018.
Source Link: Apple Inc. Balance Sheet
Advantages
Some of the major advantages of ROIC are:
- This financial metric takes into account the overall return on both equity and debt. So, it basically nullifies the impact of capital structure on profitability. As such, ROIC, unlike profitability ratios like profitability ratios like ROE, can be used to compare the performance of companies belonging to a similar industry irrespective of their difference in the capital structure. (ROE is impacted by capital structure, such that a company with higher debt tend to generate a higher return for shareholders as it benefits from a lower cost of debt)
- Easier to benchmark against WACC, wherein a higher value of ROIC vis-à-vis WACC indicates value creation for the investors and vice versa.
Relevance and Use of Return on Invested Capital
Given that it is easy to use and it overcomes the shortcomings of some of the other financial metrics, ROIC is preferred by investors in the assessment of the overall investment return of a company. However, it is important that while peer benchmarking, please make sure that it is compared with the companies that are operating in a similar industry in order to draw meaningful insights. So, overall, ROIC can be considered to be a very useful performance metric.
Recommended Article
This is a guide to Return on Invested Capital. Here we discuss how it can be calculated using a formula and a downloadable excel template and the advantages of ROIC. You can also go through our other suggested articles to learn more –
