Updated July 11, 2023
Definition of Risk Ratio
Risk Ratio (RR), or Relative Risk, refers to the excess return generated for the excess risk measured in terms of dollar value relative to the benchmark against which the risk is to be measured.
It can also be interpreted in relative terms, which helps analyze the risk ratio in an exposed group vis a vis risk in an unexposed group. In other words, it describes the happening of an event after risk exposure compared to without exposure to that risk. Modern-day enterprises make a lot of use of Risk Ratios to determine the impact various risk factors bring and also to hedge against negatively correlated risk factors.
Explanation
The risk Ratio is a relative risk matrix frequently used to measure risk from a comparative perspective. Many risk measures interpret risk from a standalone perspective, and RR explains risk from a comparative perspective.
They understand it through an example, the probability of one division of an Investment bank working from the office and getting affected by COVID due to one of its employees getting COVID infection against another division of the same investment bank with all its employee working at home. Thus, it indicates the relative risk of getting COVID from working in an office versus working from home.
Risk Ratio formula
The formula for RR is straightforward and is shown below:
How to Calculate?
Calculating the RR requires first determining the following:
- Independent probability of an event occurring under one group with exposure to a particular item.
- Independent probability of occurring an event occurs under another group with non-exposure to a particular item.
- As mentioned in the above step, the individual probabilities determined should have the same sample size for uniformity purposes and equal other things except for exposure to a specific item; for instance, a study to find the RR of people affected by Cancer in sure participants with and without smoking.
- Dividing the probability of occurring an event with exposure by the probability of an event without exposure.
An illustration to explain the above steps is enumerated below:
| Group 1 | |
| No of Participants | 1000 |
| Are participants, smoker | Yes |
| Probability of developing Cancer | 0.2 |
| Group 2 | |
| No of Participants | 1000 |
| Are participants, smoker | No |
| Probability of developing Cancer | 0.08 |
| Risk Ratio | 0.20/0.08 |
| 2.5 |
Thus RR of 2. 50 signifies the probability of developing Cancer among smokers is 2. 50 times more than non-smokers.
Example of Risk Ratio
Let’s understand the RR with the help of an example.
ABC Limited is into Risk Advisory Consulting. The company has two teams. Namely, A and B. Team A comprises specialists with CFA and FRM qualifications. Similarly, Team B has specialists; however, none have qualifications in CFA and FRM. The Group head has to assign a new project of risk consulting for a Global Bank which prefers CFA and FRM.
- Team A has a client success execution of 93 percent.
- Team B has a client success execution of 80 percent.
Accordingly, in this case, the RR between assigning the new risk Consulting project is as follows:
| Client Success Execution of Team A ( in percent) | 93 |
| Client Success Execution of Team B ( in percent) | 80 |
| Risk Ratio | 93/80 |
| 1.16 |
Interpretation of Risk Ratio
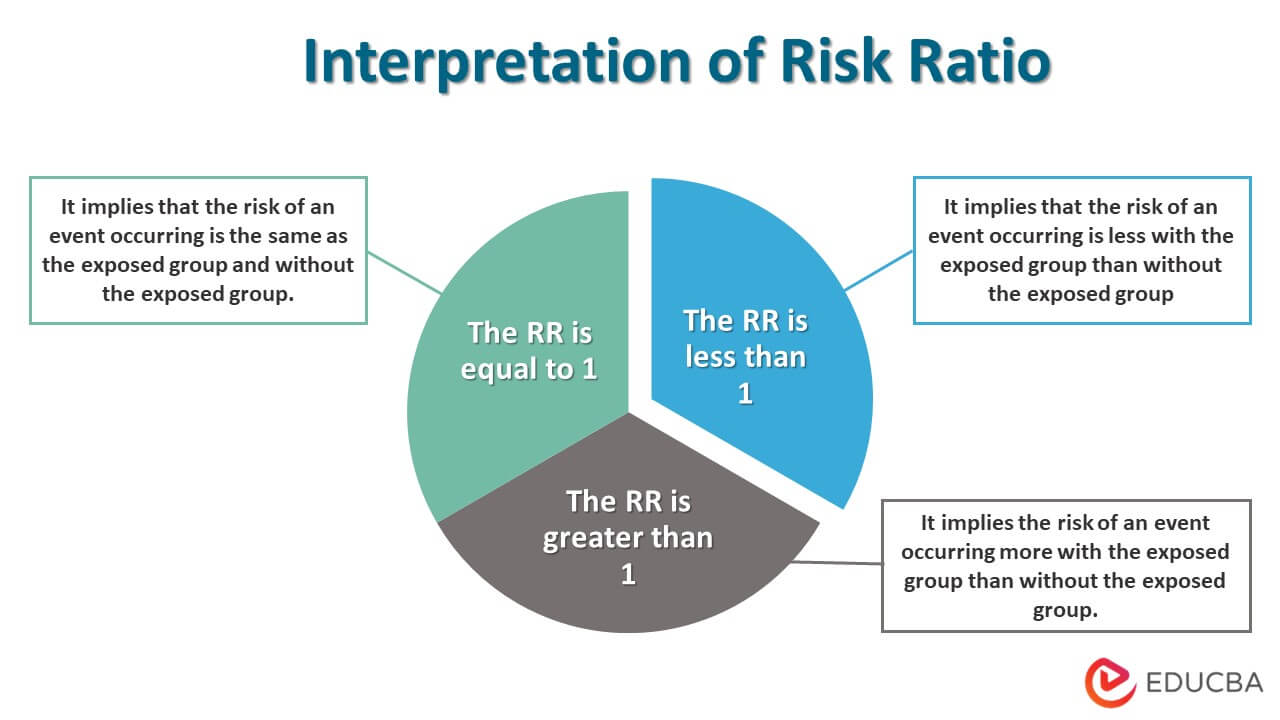
RR helps in understanding the relative risk under different situations/scenarios. The ratio also helps understand the impact of different scenarios and exposed groups on the resulting outcome. This can be interpreted in three ways:
- The RR is equal to 1: It implies that the risk of an event occurring is the same as the exposed group and without the exposed group.
- The RR is less than 1: It implies that the risk of an event occurring is less with the exposed group than without the exposed group. This can be explained through a current scenario where people wearing a mask have less probability of getting infected with COVID than those not.
- The RR is greater than 1: It implies the risk of an event occurring more with the exposed group than without it.
Risk Ratio Confidence Interval
The relevance of the Confidence Interval in RR makes sense when the RR is different from 1. Confidence Interval tells the likely probability of the risk ratio; in such a manner, let’s say a 90 percent Confidence Interval for a Risk Ratio of 1.40 will have less accuracy than a Confidence Interval of 99 percent with a Risk Ratio of 1.30.
In short higher the level of Confidence Interval, the more accurate the RR, and the lower the level of Confidence Interval less accurate the risk, other things being equal.
Risk Ratio Analysis
RR analysis involves understanding relative risk in different scenarios, which is essential to make a better decision. Also, RR helps in better management of risk. It helps analyze the factors that can result in increased or reduced risk. Also, the Risk Ratio helps find various alternate cases through which risk can be hedged effectively, leading to an overall reduction of risk exposure for the business entity.
While we appreciate the benefits of RR analysis for the business, we need to be well versed with its limitation based on the confidence interval undertaken and the focus on a single risk factor compared to multiple risk factors.
Conclusion
The risk Ratio helps in understanding risk from a relative perspective. Each function involved a certain amount of absolute Risk; RR helps understand the same from a comparative perspective. It helps identify the exposure ratio to a specific risk factor compared to without exposure and helps properly analyze Relative Risk for the business entity. Banks and Financial Institutions frequently use the risk ratio to assess various risk propositions.
Recommended Articles
This is a guide to Risk Ratio. Here we also discuss the definition and how to calculate the risk ratio, along with an interpretation and an example. You may also have a look at the following articles to learn more –


