Updated April 6, 2023

Introduction to Ruby Profiler
Many times during development, we focus on getting a result to be done in the minimum time, but we forget about the performance of the application; it may be possible that some unnecessary loops are running, and it is also possible that there may be some codes which are not executing and written unnecessary, so to tackle all these problems we have a tool is Ruby which called as the Ruby Profiler. Ruby profiler gives a mechanism where we can check the performance of the code, and also we can analyse the code; we can do the Profiler of code on the time of final commit to the files.
Syntax:
Look in the below syntax for simple Ruby Profiler; we can explain the below code in the following steps:
- File Containing Code: This is the file that contains the code.A profiler will check the performance of this file.
- An argument to File: This is an optional parameter. It is used in case the file on which we are running the Profiler needs some arguments.
ruby -r profile [file containing code] [argument to file]How Does Ruby Profiler Work?
The profiler will check for each operation which we perform on our code block; we can explain its working in the following steps.
- It will check what is the time taken by performing some activity on the code file.
- Like if code is performing any IO work there it will separately capture it along with time. In the same way any numeric and string calculation then it will capture its execution time and more details.
Examples to Implement Ruby Profiler
Let us understand Profiler with the help of some examples:
Example #1
Below is a simple example where we are simply printing some message, and with a Profiler command, we are looking at the performance of the code. Please see the below example, along with the screen of output.
The command we run for checking the performance of the code is given below.
Command:
ranjan@CLLAP-CHN-0227:~/Documents/projects/rubytest$ cat test.rbCode:
puts "Hello , friends how are you?"Output:
Example #2
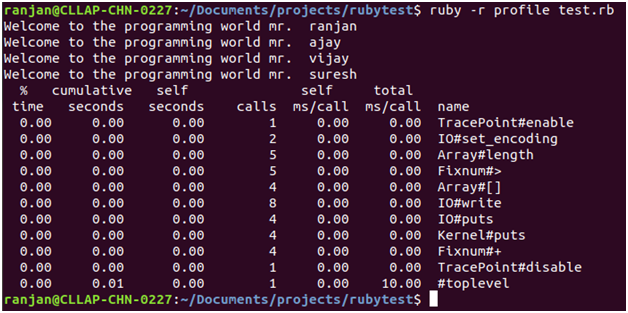
Below is a simple example where we are working on some array of students and printing a welcome message for them and with a Profiler command we are looking at the performance of the code. Please see the below example, along with the screen of output.
The command we run for checking the performance of the code is given below.
Command:
ranjan@CLLAP-CHN-0227:~/Documents/projects/rubytest$ cat test.rbCode:
$studentsLists = ["ranjan","ajay","vijay","suresh"]
$a=0
while $studentsLists.length()>$a  do
@s=$studentsLists[$a]
puts("Welcome to the programming world mr.  #@s" )
$a +=1
end
Output:
Example #3
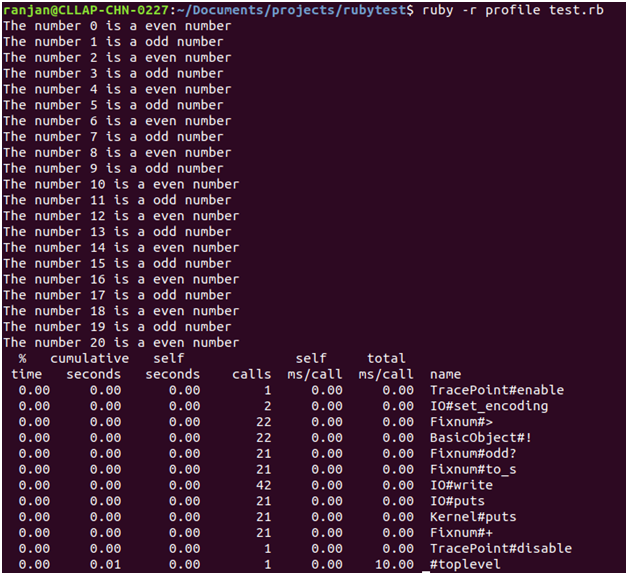
Below is a simple example where we are printing the odd and even number upto 20 numbers and with a Profiler command, we are looking at the performance of the code. Please see the below example, along with the screen of output.
The command we run for checking the performance of the code is given below.
Command:
ranjan@CLLAP-CHN-0227:~/Documents/projects/rubytest$ cat test.rbCode:
$oddeven = 0
while !($oddeven> 20) do
if $oddeven.odd?
puts "The number #$oddeven is a odd number"
else
puts "The number #$oddeven is a even number"
end
$oddeven += 1
end
Output:
Example #4
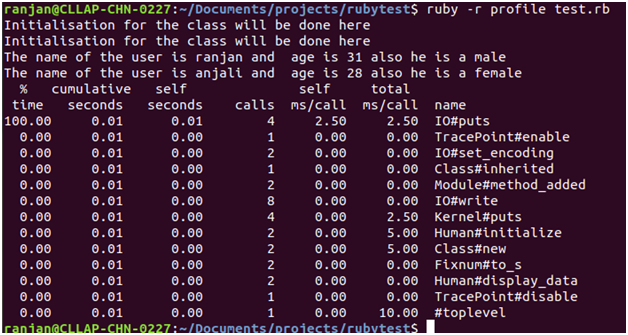
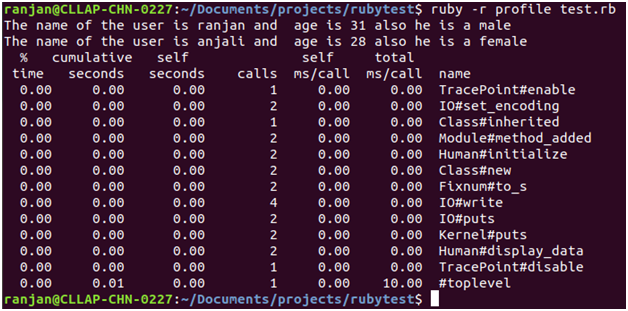
Below is a simple example where we are creating a class, and a class contains some methods, and we are calling these methods, and with a Profiler command, we are looking at the performance of the code. Please see the below example along with the screen of output.
Command we run for checking performance of the code is given below.
Command:
ranjan@CLLAP-CHN-0227:~/Documents/projects/rubytest$ cat test.rbCode:
class Human
# Method for initialisation inside the class
definitialize()
# Initialising the variables
puts "Initialisation for the class will be done here"
end
defdisplay_data(name,age,sex)
puts "The name of the user is #{name} and  age is #{age} also he is a #{sex}"
end
end
# Creating an objects and passing parameters  for initialization
object1 = Human.new()
object2 = Human.new()
object1.display_data("ranjan", 31, "male")
object2.display_data("anjali", 28, "female")
Output:
Example #5
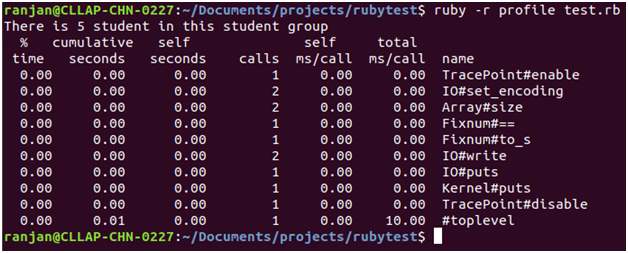
Below is a simple example where we are working on some array of students and using if else on the array of students for printing, and with a Profiler command we are looking at the performance of the code.
Please see the below example, along with the screen of output.
The command we run for checking the performance of the code is given below.
ranjan@CLLAP-CHN-0227:~/Documents/projects/rubytest$ cat test.rbCode:
#Checking of the number of students inside any student group
#Defining the student variable here , which contains the group of multiple students .
students = ['ranjan','ajay','vijay','sujit','akash']
#Here we are checking the length of array
if students.size ==1
Puts "This is Single student group as there is only one student"
else
puts "There is #{students.size} student in this student group"
end
Output:
Example #6
Below is a simple example where we are using some class and initialization and method calls, and with a Profiler command, we are looking at the performance of the code. Please see the below example, along with the screen of output.
The command we run for checking the performance of the code is given below.
Command:
ranjan@CLLAP-CHN-0227:~/Documents/projects/rubytest$ cat test.rbCode:
class Human
# Method for initialisation inside the class
definitialize(name ,age ,sex )
# Initialising the variables
@name = name
@age = age
@sex =sex
end
defdisplay_data()
puts "The name of the user is #{@name} and  age is #{@age} also he is a #{@sex}"
end
end
# Creating an objects and passing parameters  for initialization
object1 = Human.new("ranjan", 31, "male")
object2 = Human.new("anjali", 28, "female")
object1.display_data()
object2.display_data()
Output:
Conclusion
From this tutorial, we learned the basics concept of the Profiler, we learned about the working and syntax of the Profiler in Ruby; we also learned that it will be useful to understand the performance of the code with the help of the several examples.
Recommended Article
We hope that this EDUCBA information on “Perl print hash” was beneficial to you. You can view EDUCBA’s recommended articles for more information.

