Updated July 26, 2023
Sales Formula (Table of Contents)
What is Sales Formula?
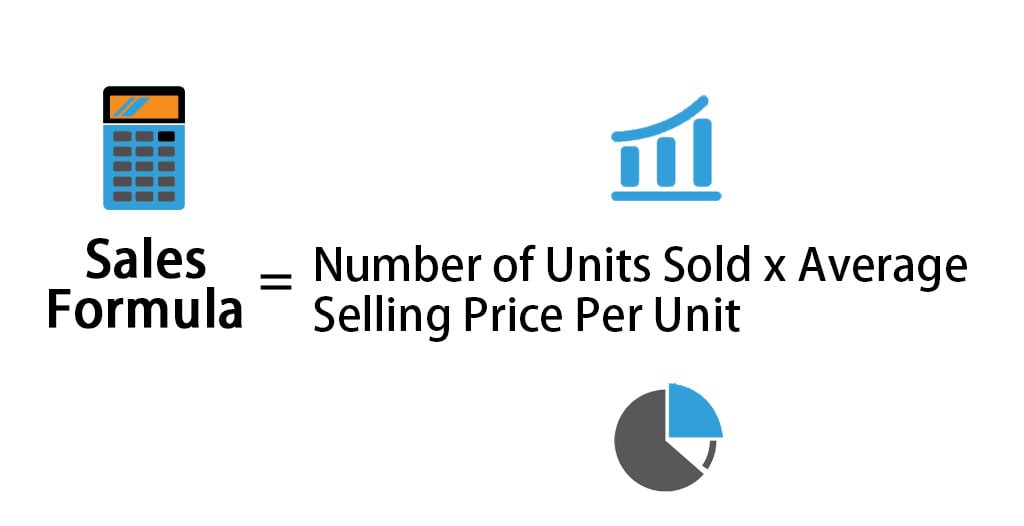
The term “sales” refers to the revenue recognized in a company’s income statement by selling goods or providing services during a specified period. The time frame for capturing sales is usually a month, a quarter, or a year. Typically, a company’s sales are the first line of time in its income statement. Sales are also known as gross sales, the aggregate of all receipts and billings realized from sales of goods or services. The formula for sales can be derived by multiplying the number of the units of the goods sold or the service provided and the average selling price per unit of that good or service. The mathematical representation of the formula is:
Examples of Sales Formula (With Excel Template)
Let’s take an example to understand the calculation of the Sales Formula in a better manner.
Sales Formula – Example #1
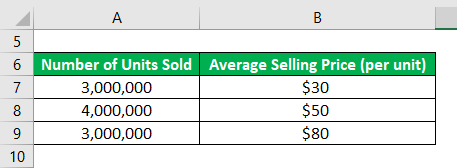
Let us take the example of a toy-making company that sold 10 million toys during the year. Out of the total, 3 million toys were sold at an average selling price of $30 per unit, another 4 million toys were sold at an average selling price of $50 per unit, and the remaining 3 million toys were sold at an average selling price of $80 per unit. Calculate the sales revenue of the toy maker during the year.
Solution:
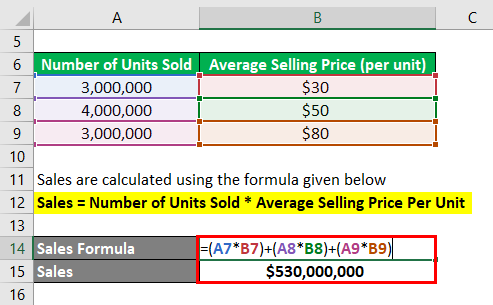
The formula to calculate Sales is as below:
Sales = Number of Units Sold * Average Selling Price Per Unit
- Sales = 3,000,000 * $30 + 4,000,000 * $50 + 3,000,000 * $80
- Sales = $530,000,000 or $530 Million
Therefore, the toy maker generated sales of $530 million during the year.
Sales Formula – Example #2
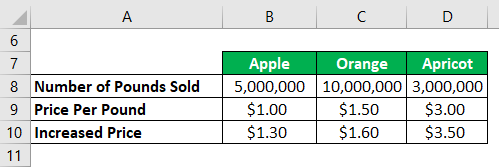
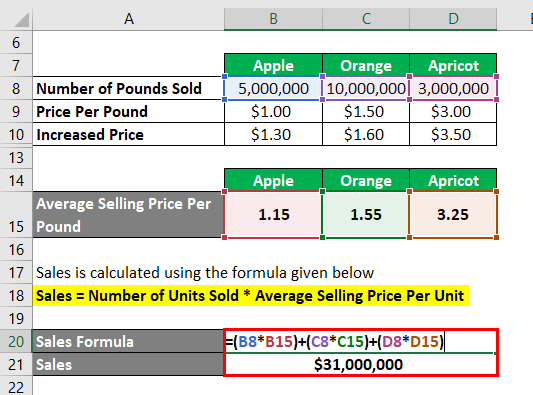
Let us take the example of a fruit wholesale trader. The trader deals in three fruit segments – apple, orange, and apricot. During the year, the fruit wholesaler sold 5 million pounds of apples, 10 million pounds of oranges, and 3 million pounds of apricot. The prices of the apples varied in the range of $1.00 per pound to $1.30 per pound, while the prices of oranges ranged from $1.50 per pound to $1.60 per pound. The prices of apricots oscillated between $3.00 per pound and $3.50 per pound. Calculate the sales revenue of the fruit wholesaler during the year.
Solution:
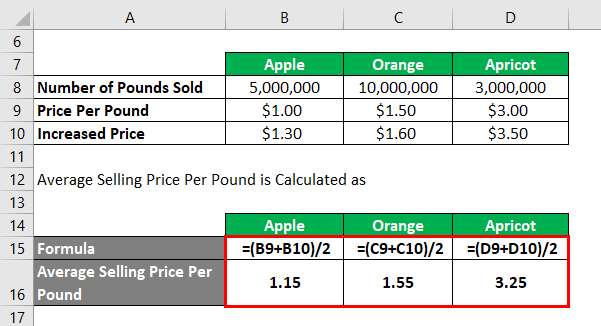
The calculation of the Average Selling Price Per Pound is as below:
- Average Selling Price Per Pound apple = ($1.00 + $1.30) / 2 = $1.15
- Average selling price per pound orange = ($1.50 + $1.60) / 2 = $1.55
- Average selling price per pound apricot = ($3.00 + $3.50) / 2 = $3.25
The formula to calculate Sales is as below:
Sales = Number of Units Sold * Average Selling Price Per Unit
- Sales = Number of pounds sold apple * Average selling price apple + Number of pounds sold orange * Average selling price orange + Number of pounds sold apricot * Average selling price apricot
- Sales = 5,000,000 * $1.15 + 10,000,000 * $1.55 + 3,000,000 * $3.25
- Sales = $31,000,000 or $31 Million
Therefore, the wholesale fruit trader sold fruits worth $31 million during the year.
Sales Formula – Example #3
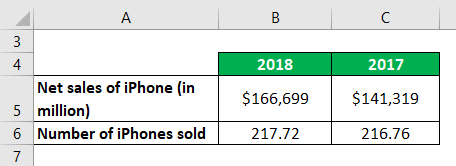
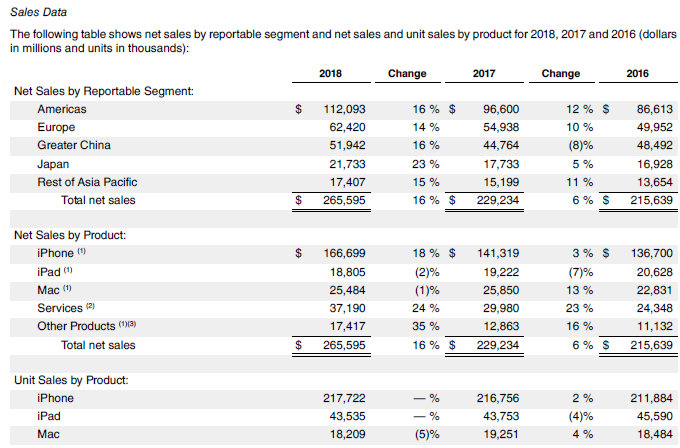
Let us take the example of Apple Inc. to calculate the change in the net selling price of iPhone during the year 2018 vis-à-vis 2017 based on the given information
Solution:
The formula to calculate Net Selling Price is as below:
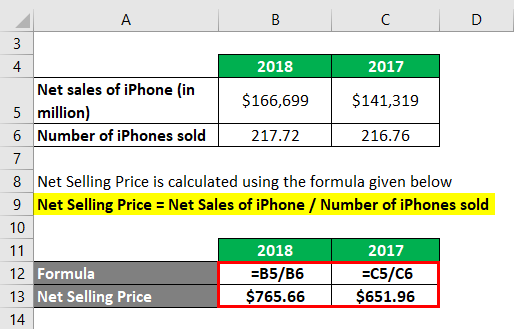
Net Selling Price = Net Sales of iPhone / Number of iPhones sold
For 2018
- Net Selling Price 2018 = Net Sales of iPhone 2018 / Number of iPhones Sold 2018
- Net Selling Price 2018 = $166,699 Million / 217.72 Million
- Net Selling Price 2018 = $765.66
For 2017
- Net Selling Price 2017 = Net Sales of iPhone 2017 / Number of iPhones Sold 2017
- Net Selling Price 2017 = $141,319 Million / 216.76 Million
- Net Selling Price 2017 = $651.96
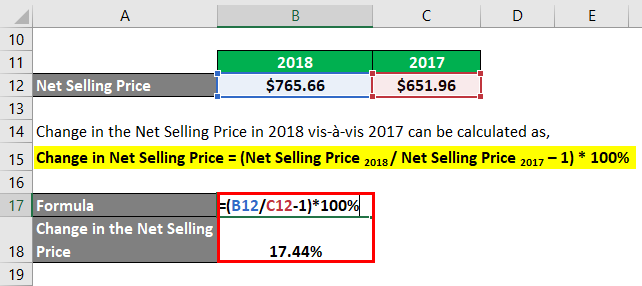
Change in the Net Selling Price in 2018 vis-à-vis 2017 can be calculated as,
- Change in Net Selling Price = (Net Selling Price 2018 / Net Selling Price 2017 – 1) * 100%
- Change in Net Selling Price = ($765.66 / $651.96 – 1) * 100%
- Change in Net Selling Price = 17.44%
Therefore, the net selling price of the iPhone increased by 17.44% in 2018.
Link: Sales data of iPhone
Explanation
The formula for sales can be derived by using the following steps:
Step 1: Firstly, ascertain the total number of units of the goods sold or services delivered during a specific period of time, say a month, quarter, or year.
Step 2: Next, calculate the average selling price per unit of the good or service. The reason for computing the average selling price is that the selling price might vary across time, so it is better to take the average selling price per unit.
Step 3: Finally, the formula for sales can be derived by multiplying the number of units of the goods sold or service delivered and the average selling price per unit of that good or service, as shown below.
Sales = Number of Units Sold * Average Selling Price Per Unit
Relevance and Use of Sales Formula
Although profit seems to take the limelight, sales are an equally important measure for any business. The sales assessment can result in actionable information that the profitability may not capture. One of the major use of sales is that it is predominantly used to examine trends over a period of time that helps ascertain the growing operational strength or weakness of a business. Further, analysis of sales trends across a year also provides insight into the seasonality exhibited by the business.
Sales Formula Calculator
You can use the following Sales Formula Calculator
| Number of Units Sold | |
| Average Selling Price Per Unit | |
| Sales | |
| Sales = | Number of Units Sold x Average Selling Price Per Unit |
| = | 0 x 0 = 0 |
Recommended Articles
This is a guide to Sales Formula. Here we discuss how to calculate the Sales Formula along with practical examples. We also provide a Sales calculator with a downloadable Excel template. You may also look at the following articles to learn more –
