Updated March 15, 2023

Introduction to SAS boxplot
The SAS boxplot is one of the GUI like graphical user representations of the data groups in the numerical set of SAS datas which calculates the mean, quartiles, minimum, and maximum data observations to follow the set of procedures like a cross side-by-side box. It needs the whiskers plots’ measurements to control the style box plots, axis value, labels, and other additional variable quantities.
Key Takeaways
Some of the main points which need to be remembered related to the boxplots,
- The top and bottom of the box which always the main and almost it identified as the first and third quartiles.
- SAS simple box plot which always created the PROC SGPANEL and PROC SGPLOT
- Then the box and whisker plot is referred to as the box plot.
- The minimum, first quartile, median, third quartile and Maximum these are the five different summay and status of the SAS box plots.
- When we create the box plot’s first and third quartile, the vertical line will go to the box at the median position.
What is SAS boxplot?
Boxplot of the SAS which represented the GUI and it follows the data groups for set of numerical datas that extend the vertical lines from whiskers boxes outside the upper and lower quartiles. Then the bottom and top of the boxes are always denoted as the first and third quartiles of inside the boxes, which is always used for the second quartile median. Mainly the SAS simple boxplot was created using the procedure called PROC SGPLOT and PROC SGPANEL boxplots on the datasets. We created the dataset for more subsequent entities and created the variable categorized groups in both simple and vertical boxplot panels. The horizontal boxplot panels also calculated the number of rows and columns for each divider section and the graphs for multiple set of group panels that accomplished.
How to Create SAS boxplot?
It is the standardized way for to show the data distribution of the variables that always use the different statistics like minimum, first quartile, median, third quartile and the maximum. Besides these statistics, the boxplot also uses the SAS with default mean, boxplot whiskers, and the other outliers. To create the boxplot in SAS that follows the standard SGPLOT procedure with parameters like DATA=-option and VBOX statement that let the SAS for variable specification more options than the stored procedure. With CATEGORY=-option that specified the variable with different categories and called the VBOX statement as the category, group and labels.
Steps to Create SAS boxplot:
- Navigate to the below URL after login,
- https://odamid-apse1-2.oda.sas.com/SASStudio/main?locale=en_GB&zone=GMT%252B05%253A30&ticket=ST-100523-qeSyCHl3YIDU06sPgrfa-cas
- And I created some sample boxplot code with a vertical box-like vbox format,
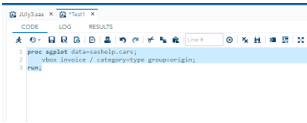
- proc sgplot data=sashelp.cars;
- vbox invoice / category=type group=origin;
- run;
7. Her the procedure called proc sgplot is the default stored procedure for to access the SAS dataset called sashelp.cars. We can also use other datasets like the below,
8. proc sgplot data=sashelp.air;
9. vbox AIR / category=DATE group=AIR;
10. run;
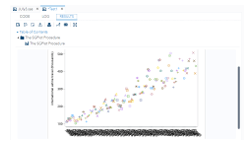
11. And I can get the following chart as the output results,
12. Like that we can use the SAS dataset with different areas of the boxplots for lower, upper, bottom and top quartiles.
SAS boxplot multiple panels
The SAS boxplot will be used with the data groups for more than one boxplot and across the various areas like stored procedures like the SGPLOT procedure to access the horizontal simple and vertical box statement, which helps to denote the VBOX statement and the keyword for using the forward-slash, CATEGORY=-option and the GROUP=-option for to creating the boxplot per group. We can customize the boxplot in the SAS data appearance for X-axis, Y-axis, and the LABEL=-option quotes. The dataset, like many boxplots, can be accessed to the input variables that appear on the same plot despite the fact that they can be used on different scales. It has different types like ANNOTATE, DATA, GOUT, PLOT these are the some different and main statements for the procedure statement.
We can also use do and other loops for creating and setup the multiple panels.
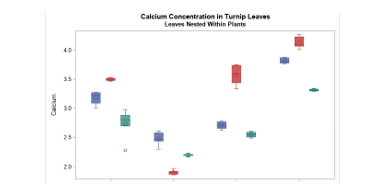
The above screenshot shows the example flow for the SAS nested loop related to the natural concepts. Like x-axis like Calcium, and the y axis is Plant.
Example
data first;
input id $ name;
datalines;
1 123
2 456
3 789
4 101
5 3456
6 34534
;
run;
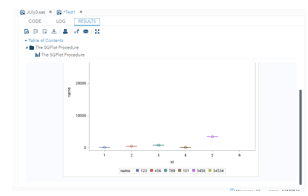
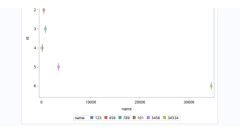
proc sgplot data=work.first;
vbox name / category=id group=name;
run;
Sample Output:
Hbox code:
proc sgplot data=work.first;
hbox name / category=id group=name;
run;
The above example we used the Hbox and Vbox boxplots in different areas.
Based on the requirement, it may vary and call the required inputs by the user end, and the same will be produced as the output graph.
Frequently Asked Questions
It has some FAQ’s for understanding the SAS boxplots with sophisticated information.
- How many types of SAS data are using the boxplot?
Answers:
The simple boxplot, Horizontal boxplot, Vertical boxplot, box and whisker plot these are the some types of boxplot SAS data.
- How will run the boxplot in SAS?
Answers:
It will create by using the PROC SGPLOT and PROC SGPANEL boxplots with the same dataset and followed by the subsequent datasets.
- What are the five different components of the SAS box plot?
Answers:
- Minimum,
- First Quartile,
- Median,
- Third Quartile,
- Maximum
- Explain the types of SAS box plots with examples.
Answers:
Simple Boxplot:
It’s a boxplot to choose the variable from the dataset that mainly represents the categories and other variables.
Vertical Panels:
The third variable helps to divide the graphs into multiple sets of panels.
Horizontal Panels:
Its similar to the vertical box plots but its used for divided into the multiple set of rows.
- What is the range or limit in the SAS box plot?
Answers:
The SAS box plot’s limit is calculated using the maximum and minimum dataset values.
Conclusion
The SAS box plot is the feature and the most important characteristics for the data observations in the single and multiple groups. It has the set of procedures and keywords for to enable the style box plots with several default and statistics methods on the numerical set of data’s with representation groups.
Recommended Articles
This is a guide to SAS boxplot. Here we discuss the Definition, What is SAS boxplot, How to create SAS boxplot, Steps to create SAS boxplot, Key Takeaways. You may also have a look at the following articles to learn more –
