Updated March 17, 2023
Introduction to Scikit Learn PCA
The following article provides an outline for Scikit Learn PCA. This is the second unsupervised algorithm used to implement machine learning and AI. The PCA is nothing but the Analysis used to reduce the dimensionality of the dataset. In other words, we can say that it is used to reduce the higher dimension into the lower dimension space. In this unsupervised algorithm input, data might be centered, but it is not scaled, so we need to scale it according to our requirements.
Key Takeaways
- It is used to remove the correlated features.
- It helps us to improve the performance of machine learning algorithms.
- With the help of PCA, we can reduce overfitting.
- After applying PCA, we get better visualization as well as understanding.
What is Scikit Learn PCA?
Direct dimensionality decreases by utilizing Singular Value Decomposition of the information to extend it to a lower layered space. The information is focused yet not scaled for each component before applying the SVD. PCA is a direct dimensionality decrease strategy. It changes a bunch of corresponded factors (p) into a more modest k (k<p), the number of uncorrelated factors called head parts while holding however much of the variety in the first dataset as could reasonably be expected.
The fundamental idea driving the PCA is to consider the connection among highlights. If the connection is exceptionally high among a subset of the elements, PCA will endeavor to consolidate the profoundly related includes and address this information with fewer directly uncorrelated highlights. The calculation continues playing out this relationship decrease, tracking down the headings of the most extreme change in the first high-layered information and extending them onto a more modest layered space. These recently inferred parts are known as head parts.
How to Use Scikit Learn PCA?
Let’s see how we can use PCA in Scikit Learn as follows:
First, we must import all required libraries and plot styles. All libraries are python based, and it is helpful to analyze data, visualization, and calculation as below.
Code:
import numpy as np
import pandas as p
import seaborn as se
import matplotlib.pyplot as pl
plt.style.use('ggplot')
In the second step, we need to fetch and prepare the data. In this step, we need to use datasets that are available in Scikit Learn. Still, the downloaded dataset is not in a suitable format, so we need to manipulate the dataset for processing; here, we can use an already readymade dataset and convert it into the pandas DataFrame, a familiar format we want. For the sample, the dataset is shown below screenshot.
Output:
In the third step, we need to apply for the PCA. Suppose in our sample dataset, the space dimensions have 00; we call p dimensions. Now after using PCA on the project, it will be a smaller space that we call k dimensions which means k is less than p. But one more important thing about PCA is that after applying PCA, it might lose some information. Still, on the other hand, it improves the performance of algorithms that we use in machine learning and helps us reduce the hardware requirement and increase the processing speed.
After that, we can apply the PCA with different values per our requirements.
Features of Scikit Learn PCA
Now let’s see what the features of PCA below are:
- It helps us to remove the correlated features of Scikit Learn.
- Let’s see the real-time example: Suppose our dataset has thousands of features and cannot run all the features through the implemented algorithm, so what happens? It also reduces the algorithm’s performance; it is not easy to implement in any graph. So, we need to remove all those features from our dataset at that time. So first, we need to find the correlation between the features; here, we cannot find the correlation manually because of its size, so with the help of PCA, we can do it quickly and efficiently.
- PCA helps us to improve the performance of algorithms: In the above point, we already saw that due to the many features, performance would be reduced, so with the help of PCA, we can quickly improve the performance of machine learning algorithms.
- Reduce overfitting: Mainly, it occurs due to variables; generally, many variables are present in the dataset, So PCA helps us to reduce the overfitting.
- It is challenging to visualize and understand the big data dimensions, so PCA helps us transform high-level dimensional into a low level.
Example of Scikit Learn PCA
Given below is the example of Scikit Learn PCA:
In this example, we consider the breast cancer dataset for implementation as below:
First, we need to import all the required libraries as below.
Code:
import pandas as pd
import matplotlib.pyplot as pt
from sklearn.decomposition import PCA
from sklearn.preprocessing import StandardScaler
from sklearn.datasets import load_breast_cancer
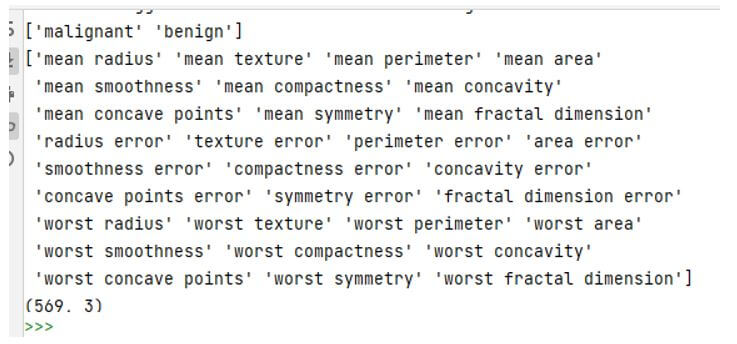
After that, we need to load the data from sklearn, and we know that it has 569 data items and 30 input features, so it is impossible to visualize the data. So we need to add the below code.
Code:
from sklearn.datasets import load_breast_cancer
data_s=load_breast_cancer()
data_s.keys()
print(data_s['target_names'])
print(data_s['feature_names'])
After execution, we get the following result shown in the screenshot below.
Output:
In the third step, we need to apply PCA to visualize better, so add the code below.
Code:
df=pd.DataFrame(data_s['data'],columns=data_s['feature_names'])
scaling=StandardScaler()
scaling.fit(df)
Scaled_data=scaling.transform(df)
pri=PCA(n_components=3)
pri.fit(Scaled_data)
var=pri.transform(Scaled_data)
print(var.shape)
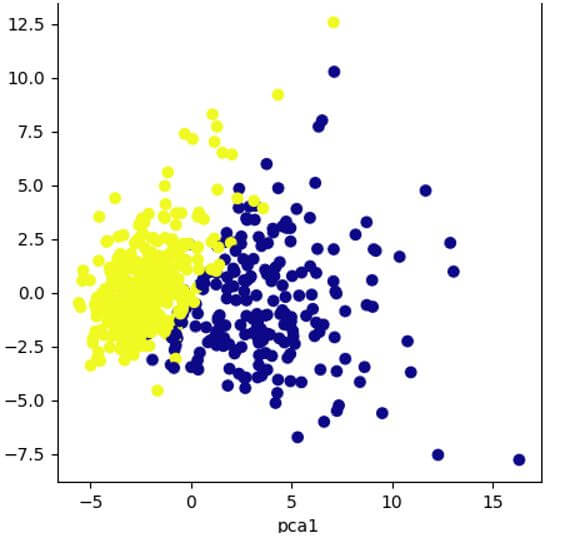
After that, we need to plot the graph so add the component below.
Code:
pt.figure(figsize=(5,5))
pt.scatter(var[:,0],var[:,1],c=data_s['target'],cmap='plasma')
pt.xlabel('pca1')
pt.ylabel('pca2')
Output:
FAQ
Other FAQs are mentioned below:
Q1. What is PCA?
Answer:
PCA is used to make easy visualization and understanding, which helps us decompose massive data to understand easily.
Q2. How can we use PCA in Python?
Answer:
We can quickly implement PCA in Python to determine the relationship between the dataset and variables to make great visualization of data as well. As it also helps us to make an easy analysis.
Q3. Can we use PCA for classification?
Answer:
We cannot use PCA for classification, but we can make new observation points that we can consider as variables used for PCA.
Conclusion
In this article, we are trying to explore Scikit Learn PCA. In this article, we saw the basic ideas of Scikit Learn PCA and the uses and features of these Scikit Learn PCA. Another point from the article is how we can see the basic implementation of Scikit Learn PCA.
Recommended Articles
This is a guide to Scikit Learn PCA. Here we discuss the introduction, example, and how to use scikit learn PCA, along with features and FAQ. You may also have a look at the following articles to learn more –


