Updated May 25, 2023
Introduction to 7 Quality Tools
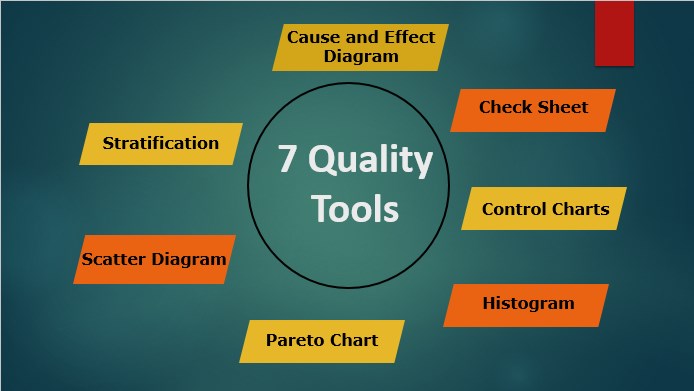
The 7 basic tools help us improve, guide, and develop the project with a quality strategy. This is a graphical representation to evaluate the data. This practice was first founded by Japan and implemented in a training program. Later found the improvement of quality in complex issues industries of the entire country, eventually using quality spreaders all over the world. This is used in detailing various phases of the six sigma process, which is the continuous improvement process in the industry.
The effective use of 7 quality tools helps maintain the standards of quality and service. This helps identify the issue in the production process and controls and provides a solution to mitigate future defects. These Quality tools map the quality and offer continuous improvement in the production process. All 7 quality tools are detailed and studied under the Lean Six Sigma Master study, which teaches quality in production. Scrum is an Agile product quality development and implements increment practices.
Types of Quality Tools
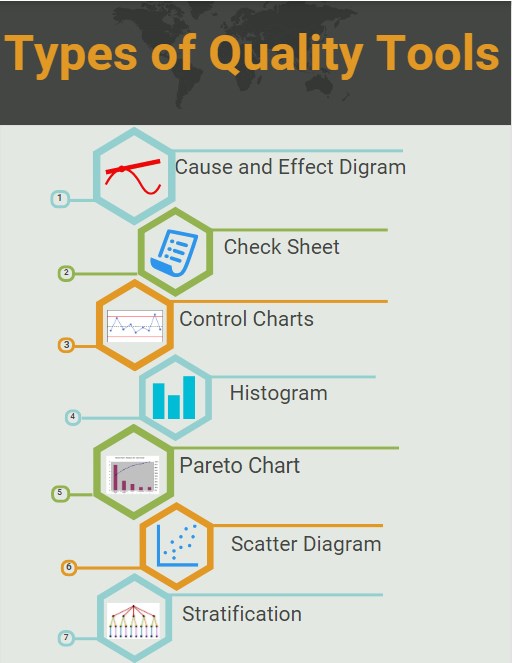
Given below are the 7 Quality types of tools:
1. Cause-and-Effect Diagram
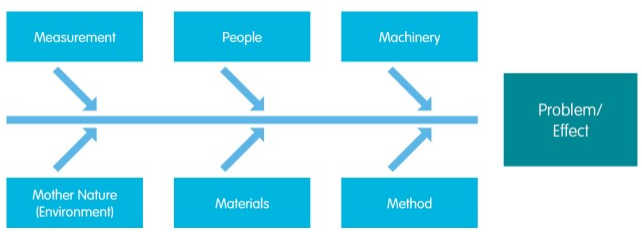
This is also called a fishbone chart or Ishikawa diagram. This is used to identify the cause and effect of the problem and re-arrange and implement ideas strategically.
When to use this method?
- This is used to identify the root cause of the problem.
- When the project diverts from its planned schedule
- Identification of Risks.
Procedure to follow:
- Estimate the problem statement and draw a straight line with branches like a fishbone.
- Analyze the problem using a brainstorming technique and implement it into the branches for a quick view of the problems.
The external factors are:
- Handling methods
- Environmental factors
- Materials factors
- Manpower
- Equipment
- Measuring factors
- Why analysis
2. Check Sheet
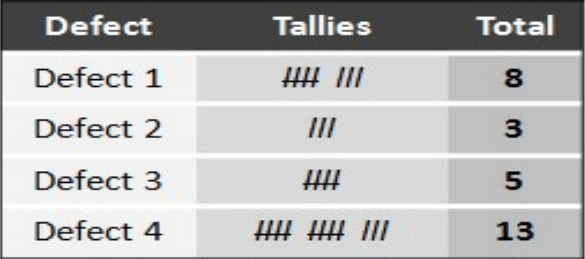
It is a sheet prepared in a structured way. This is used for collecting and analyzing information. This tool is compatible with a wide variety of applications.
When to use this method?
- This is used to analyze the repetition of the data of the same problem or similar.
- This method is used in a repetitive operative application process.
- The collective set of sheets or format for the overview of problems.
Procedure to follow:
- Create the table format in sheets.
- Input details of the problems, when, and how every week.
- Calculate the overall problem using the table and record periodically.
- Update, Review, and Monitor the data every week.
3. Control Charts
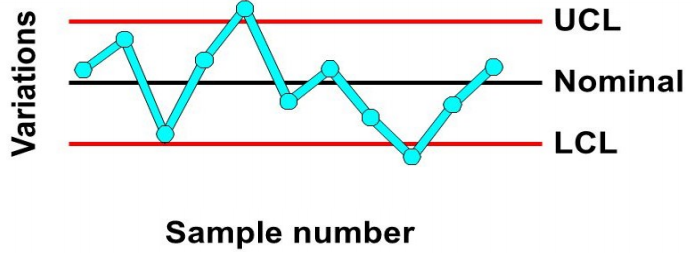
Charts are used to study how process changes overtimes in the graphical view. Comparing Present data to historical limits leads to conclusions about whether the process is in or out of control. Variations of External factors may apply.
When to use this method?
- To find the routine flow of the project.
- Identify risk tasks and mitigate them.
- To find the outcome of the actual from planned.
- Continuous improvement or change in the process.
- Sampling distribution using several occurrences.
Procedure to follow:
- Input data in the appropriate control chart.
- The scheduled time period for the data.
- Construct and analyze data.
- Every successor activity should be dependent on the predecessor activity.
- Plot the data; plot out o control should be identified and identified as X.
- We should apply out-of-control limits using the theorem.
4. Histogram
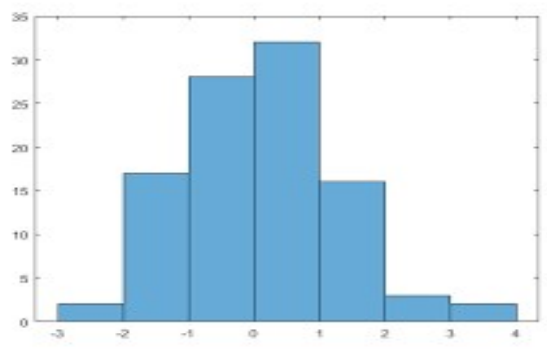
This graph is most commonly used for evaluating frequency distributions and how each value is differentiated in a different data set.
When to use this method?
- When it consists of numerical data.
- Series of data in a timely manner.
- To have a clear understanding of the data.
- Analyze whether it can meet the customer’s requirements.
Procedure to follow:
- Collect data and input in points.
- Draw X and Y plots and label the details in the bar chart.
5. Pareto Chart
It’s a bar chart that shows the factors inaccurate way.
When to use this method?
- To analyze the risk in the task process.
- Focus on a critical point when many are there.
- Visual explanation and for easy communication delivery.
- Focus on a particular element in a cluster of data.
Procedure to follow:
- Plan the category of information for input.
- Provide necessary measurement details such as cost and quantity.
- Plan the conception delivery of paring to chart (Set time frame).
- The Pareto chart should group data in a format from high to low.
- Develop the level bars of the chart.

6. Scatter Diagram
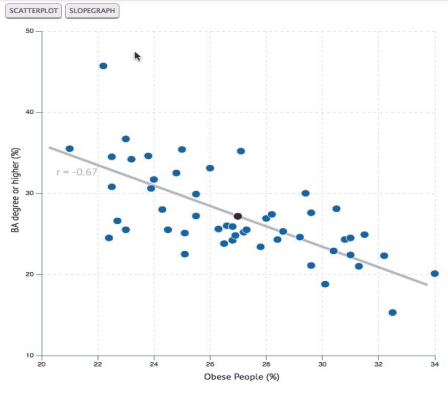
We call the pairing of graphs with numerical data a scatter diagram, which helps us find the relationship between the variables on each axis.
When to use this method?
- When multiple data with different variations.
- Finding the cause and effect are nearly the same.
- To identify the root cause of the problem.
- To analyze the scattered plots.
Procedure to follow:
- Analyze similar pairs of data.
- Construct an independent variable on X-axis and a dependent variable on Y-axis.
- Plot data in the graph to identify the points in each quadrant.
- Segregate the data in X and Y plots.
- We should not evaluate the data touching the intersection lines.
7. Stratification
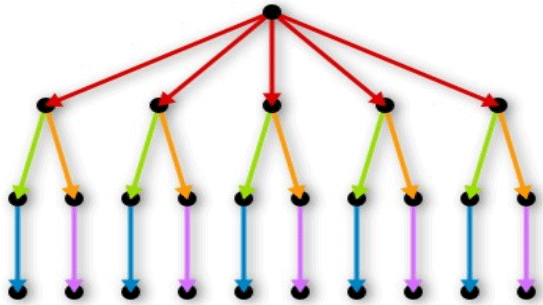
We gather the strategy used to separate data from various sources. We use stratification to develop patterns for run charts or flowcharts. Stratification is the first step in 7 Quality tools.
When to use this method?
- We perform stratification before collecting the data.
- Performed before collecting the collection of several source data.
- Different sources such as shift timings, intervals, manpower, material type, vendor, product, etc.
Procedure to follow:
- Create departments; every subset of data is provided in separate departments.
- The evaluation collects data sources beforehand so they do not impact the final results.
- Stratification shares data with other tools to evaluate the results.
- Detailing the source data before analyzing it.
Recommended Articles
This has been a guide to 7 Quality Tools. Here we discussed the 7 different types of quality tools and their methods and procedures. You can also go through our other suggested articles to learn more –


