Updated July 5, 2023
What is Sharpe Ratio?
The term “Sharpe Ratio” refers to the excess rate of return generated by a portfolio of investment when compared to the risk-free rate of return. This financial ratio was named after Nobel laureate William F. Sharpe who developed it with the intention to help investors assess the risk-adjusted rate of return of their respective investments.
The formula expressed as excess portfolio return relative to risk-free return divided by the standard deviation of its daily return which is then multiplied by the square root of 252. Mathematically, it is represented below,
Example of Sharpe Ratio (With Excel Template)
Let’s take an example to understand the calculation in a better manner.
Example #1
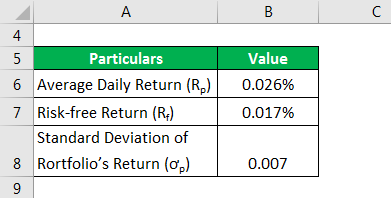
Let us take the example of an investment portfolio to illustrate the calculation of the annualized Sharpe ratio based on return information. The average daily return of the portfolio is 0.026% while the rate of risk-free return is 0.017%. Calculate the portfolio’s Sharpe ratio if the standard deviation of the portfolio’s daily return is 0.007.
Solution:
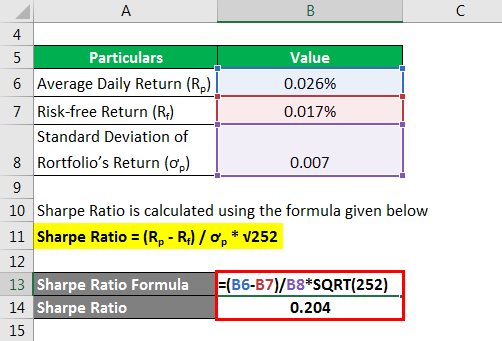
Calculate using the formula given below.
Sharpe Ratio = (Rp – Rf) / ơp * √252
- Sharpe Ratio = (0.026% – 0.017%) / 0.007 * √252
- Sharpe Ratio = 0.204
Therefore, it means that the investment portfolio generates a risk-adjusted return of 0.204 for each additional unit of risk.
Example #2
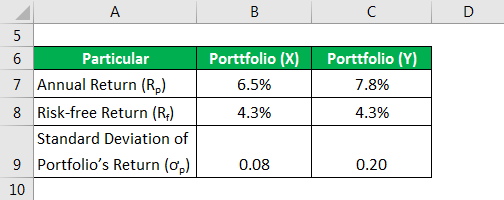
Let us now take the example of two investment portfolios X and Y to explain the calculation based on annualized return. The annual returns of portfolio X and Y were 6.5% and 7.8% respectively, while the risk-free return is 4.3%. Further, the standard deviation of portfolio X and Y were 0.08 and 0.20. calculate which of the two is a better investment option based on the Sharpe ratio.
Solution:
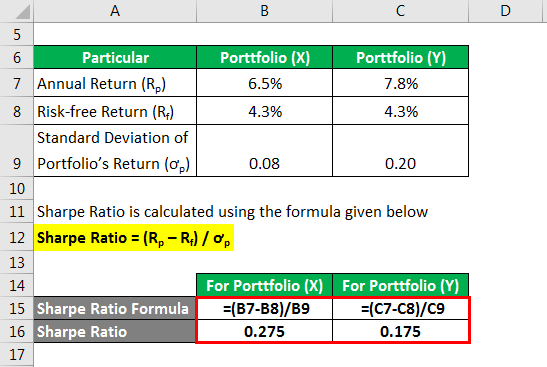
Sharpe Ratio is calculated using the formula given below.
Sharpe Ratio = (Rp – Rf) / ơp
For Portfolio X
- Sharpe Ratio = (6.5% – 4.3%) / 0.08
- Sharpe Ratio = 0.275
For Portfolio Y
- Sharpe Ratio = (7.8% – 4.3%) / 0.20
- Sharpe Ratio = 0.175
Therefore, portfolio X is higher than that of portfolio Y which indicates that despite having a lower return portfolio X is a better investment option as it offers a better risk-adjusted return given its risk level (standard deviation).
Explanation
The formula can be calculated by using the following points:
Step 1: Firstly, calculate the daily returns (frequency can be changed based on requirement) of a given investment portfolio across a certain period of time, preferably a month, a quarter, or a year. Now, compute the average return based on all the daily returns and it is denoted by Rp.
Step 2: Next, determine the daily return of a risk-free investment which is denoted by Rf. The most commonly used example of risk-free investment is 10-year government security bonds.
Step 3: Next, compute the portfolio’s excess rate of return by subtracting the risk-free return (step 2) from the portfolio’s average daily return (step 1).
Excess Rate of Return = Rp – Rf
Step 4: Next, determine the standard deviation of the portfolio’s daily return and it is denoted by ơp.
Step 5: Next, derive the formula for the same daily return by dividing the portfolio’s excess return (step 3) by the standard deviation of its daily return (step 4).
Sharpe Ratio = (Rp – Rf) / ơp
Step 6: Finally, the formula for the annualized it can be derived by multiplying the above expression by the square root of 252 (the number of trading days in a year) as shown below.
Sharpe Ratio = (Rp – Rf) / ơp * √252
Importance of Sharpe Ratio
It is very important from the point of view of portfolio analysts as it helps in the assessment of a portfolio’s performance over a given period of time. This financial metric ratio can be used to see how much the overall risk-return of a portfolio changes with the addition of a new investment. It can also be used to evaluate a portfolio’s past performance based on its historical returns. Typically, a higher value means that the portfolio offers better risk-adjusted performance than its peers and vice versa.
Advantages and Disadvantages
Below we explain the advantages and disadvantages:
Advantages
- One of the major benefits is that it is easy to understand and explain the risk-adjusted return. One doesn’t need to have a background in finance or statistics to grasp this ratio.
- Given that it is a ratio, it can be used to compare performance across asset classes or investment types. For instance, This portfolio can be compared with individual security.
Disadvantages
- One of the major limitations is that it is calculated on the basis of the standard deviation of returns as the denominator, which is used as a proxy for the total risk of the portfolio. Now, in this case, the returns are assumed to be normally distributed which is not the case most of the time in a real-life scenario.
- Another limitation of the ratio is that it can be manipulated by extending the interval of measurement as it tends to lower the estimate for standard deviation which eventually increases risk-adjusted returns.
Conclusion
However, despite some of the limitations, it can be easily said that the Sharpe ratio is a very handy financial metric for investors and analysts to keep track of investment performance during a given period.
Recommended Articles
This is a guide to Sharpe Ratio. Here we discuss how to calculate the Formula along with practical examples. We also provide a downloadable excel template. You can also go through our other related articles to learn more –


