Updated May 12, 2023
Solve Equation in Excel (Table of Contents)
- Overview of Solve Equation in Excel
- How to Add the Solver Add-in Tool?
- Example of How to Solve Equations Using Solver Add-in Tool
Overview of Solve Equation in Excel
Excel help’s us in many ways by making the task easier & simple. The Solver Add-in tool is significant for performing or solving equations in Excel. Sometimes we need to perform or carry out reverse calculations, where we need to calculate one or two variables to get the desired results.
Example: For the profit of the extra 10%, how many units need to be sold, or what marks are required for the last semester of final exams to get the distinction.
This above calculation or equations can be calculated with the help of Solver Add-in, with specific criteria.
Definition of Solve Equation in Excel
It determines the optimal value of the target cell by changing values in cells used to calculate the target cell.
It contains the below-mentioned parameters.
- Target
- Variables
- Constraints
- Formula to use to calculate
How to Add the Solver Add-in Tool?
Let’s check out how to add the solver add-in tool in Excel. Users can use the Solver Add-in to perform calculations on equations with specific criteria.
To add the Solver Add-in tool, the below-mentioned procedure is followed:
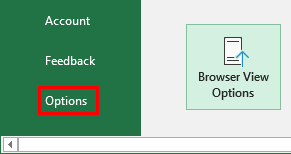
- Click on the File option or an Office Button; then, click on Excel Options.
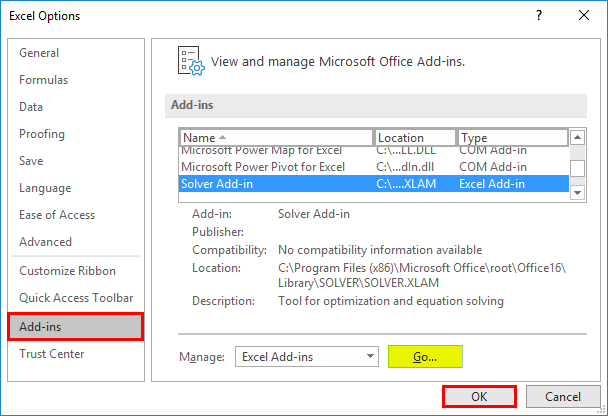
- The Excel Options window dialog box appears; under Add-ins, select Solver Add-in in the inactive application add-ins list and “Go.“
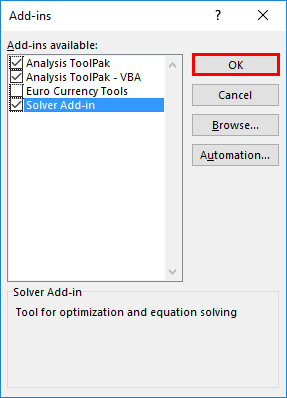
- An Add-ins window appears where you can see the list of active add-ins options. Tick the Solver Add-in and click on the “Ok” button.
Notice that the Excel sheet now displays the Solver Add-in as Solver under the “Data” tab located on the extreme right side, indicating its addition.
Example of How to Solve Equations Using Solver Add-in Tool
Calculate Variable Values For % Profit Maximization with the help of the Solver Add-in Tool.
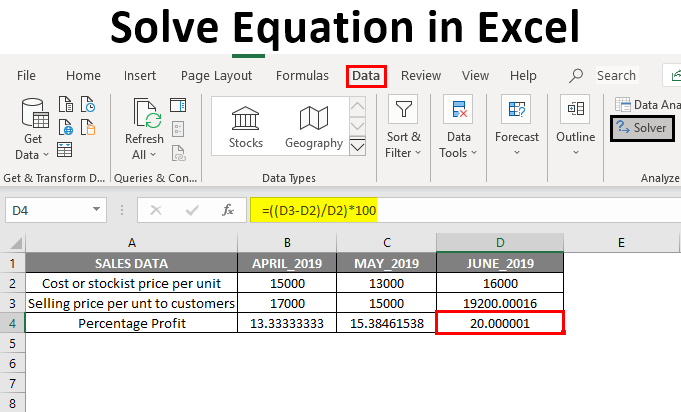
In the table above, the monthly sales data of price per unit, containing Cost or stockiest Price per unit & Selling Price per unit to customers. Now, I have April & May month with a percentage profit for each unit, i.e., 13.33% & 15.38%, respectively.
Here, B4 & C4 is the percentage profit for April & May 2019, calculated with the help of the formula below.
Formula to Find out Percentage Profit:
((Selling price per unit – Stockist price per unit)/ Stockist price per unit) *100
Variables (B2, B3 & C2, C3): Here, the variables are Cost or stockiest Price per unit & Selling Price per unit to customers, which keeps changing monthly.
Target & Constraints
I aim to take the percentage profit (%) per unit to 20%. So, for that, I need to find out the Cost or stockiest Price per unit & Selling Price per unit to customers needed to achieve a profit of 20%.
- Target Cell: D4 (Profit %) should give a 20% profit
- Variable Cells: C2 (Cost or stockiest Price per unit) and C3 (Selling Price per unit to customers)
- Constraints: D2 should be >= 16,000 and D3 should be <= 20,000
Formula to Find out Percentage Profit:
((Selling price per unit – Stockist price per unit)/ Stockist price per unit) *100
i.e. ((D3-D2)/D2) *100
Before usage of the solver add-in tool, we need to enter the profit calculator formula ((D3-D2)/D2) *100 in the target cell (D4) to calculate the 20 % profit.
To solve equations using Solver Add-in in Excel, you need to provide specific information. Now, select cell D4, and I need to launch the Solver Add-in by clicking on the Data tab and selecting a Solver.
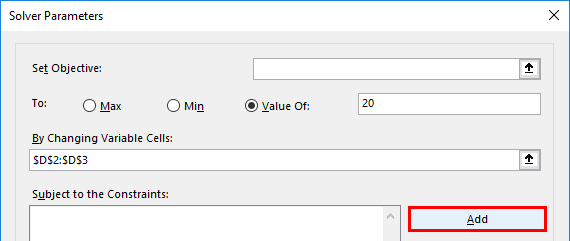
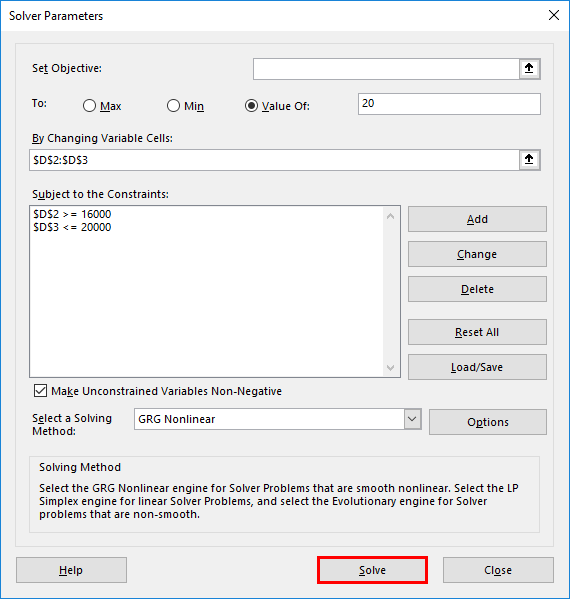
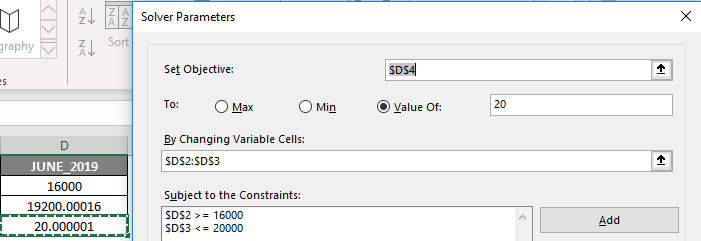
Once the solver is selected, a Solver parameter window appears, where you need to mention the “Target Cell” as a “D4” cell reference in the set objective text box and select a radio button as “Value of”, In the text box of it set the targeted profit as 20 %
In the “By changing variable cells”, select the range of D2 (Cost or stockiest Price per unit) and D3 (Selling Price per unit to customers) cell where it is mentioned as $D$2:$D$3 in the text box.
After the addition of changing variable cell range, we need to add constraints; Click on “Add” under the subject to the constraints to add columns for each label and ensure proper mailing.
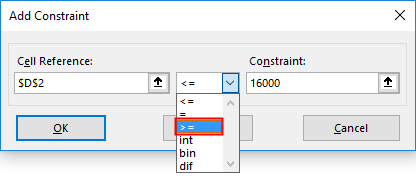
Now, the first parameter of Constraints is added by inputting the cell reference & constraint value, i.e., Cost price or stockiest Price per unit, which is either more than or equal to 16,000 (>=16000)
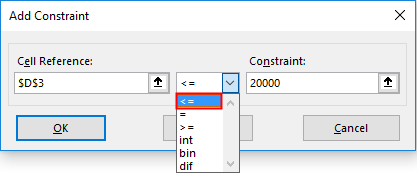
Now it reflects under Subject to the Constraints box, and again we need to click on add to add one more constraint, i.e., Selling Price per unit to customers. It is added by inputting the cell reference & constraint value, which is either less than or equal to 20,000 (<=20000)
We have added all the parameters; we just need to click on solve.
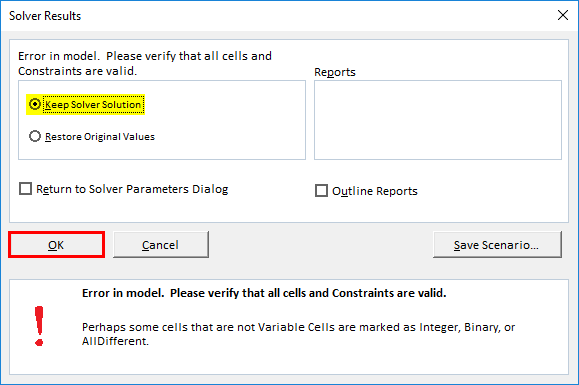
It will ask whether you want to keep the solver solution and the original values. Select these options based on your requirement; I selected the Keep Solver Solution and clicked the “Ok” button in this scenario.
Now, you will observe a change in the value in the cells D2 (Cost or stockiest Price per unit) and D3 (Selling Price per unit to customers) to 16000 and 19200, respectively, to get the 20% Profit.
Things to Remember About Solve Equations in Excel
Most of the third-party Excel add-in program provides solve equations & data analysis tools for statistical, financial, and engineering data. Other tools & functions which are used to solve equations in Excel are:
- What-If Analysis: It is also used to solve equations & data analysis, allowing you to try out different values (scenarios) for formulas to get the desired output.
- Goal Seek:it’s an inbuilt function under What-If Analysis that helps users solve equations by sourcing cell values until the desired output is achieved.
Recommended Articles
This is a guide to Solving Equation in Excel. Here we discuss how to add the Solver Add-in Tool and solve equations with Solver Add-in Tool in Excel. You can also go through our other suggested articles to learn more –
