Updated July 24, 2023
What is the Sortino Ratio?
The Sortino ratio is a kind of variation of Sharp ratio where it takes into consideration the harmful volatility and differentiates the same from the total overall volatility by measuring the risk-adjusted return of a portfolio of asset or investment portfolio, or a strategy, while it penalizes those returns falling lower from the user’s target that is those having downward deviation.
For calculating the Sortino ratio, the Portfolio’s actual return is deducted from the minimum accepted or expected return. The above difference is divided by the standard deviation of the negative asset returns or the downward deviation.
The formula is mathematically represented as below:
Where,
- r: Expected Return
- rf: Risk-Free Rate of Return
- σd: Standard Deviation of Negative Assets Return / Downside Deviation
Example of Sortino Ratio (With Excel Template)
Let’s take an example to understand the calculation of the Sortino Ratio in a better manner.
Example #1
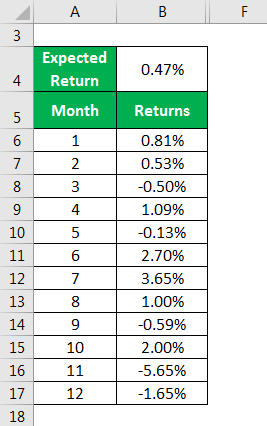
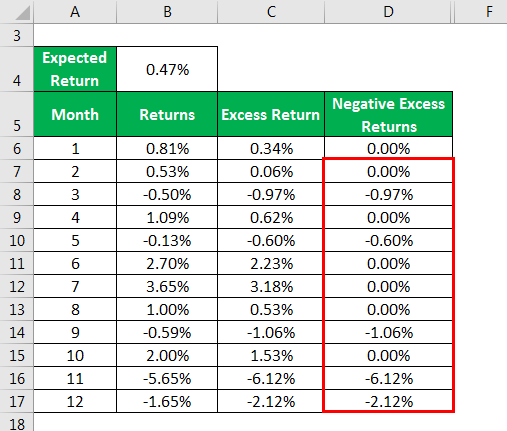
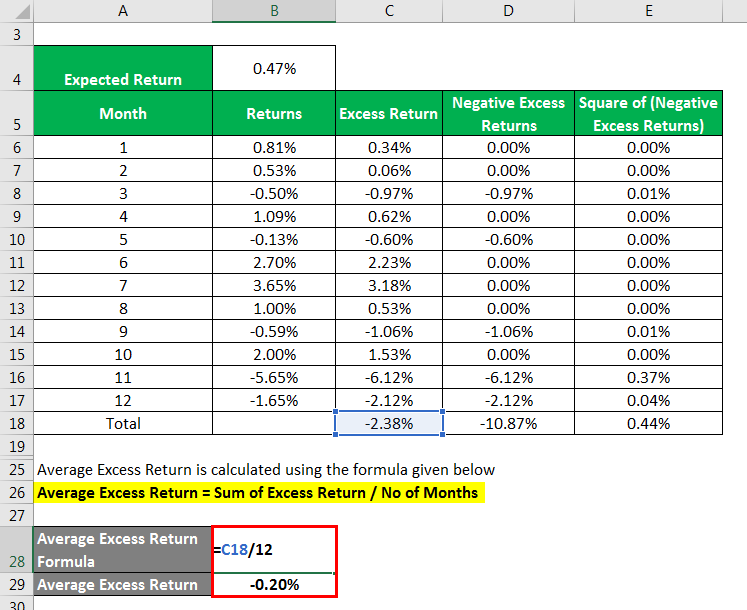
The average return percentage for 12 months of a company XYZ Ltd is given as follows. The expected return of the portfolio is 0.47%. Calculate the Sortino ratio of the company.
Solution:
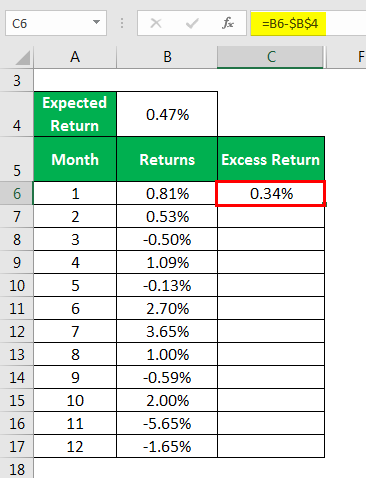
Excess Return is calculated as:
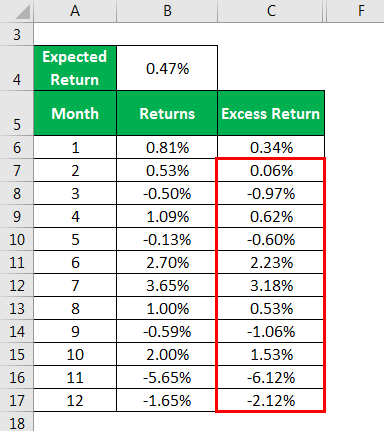
Similarly, calculated as below.
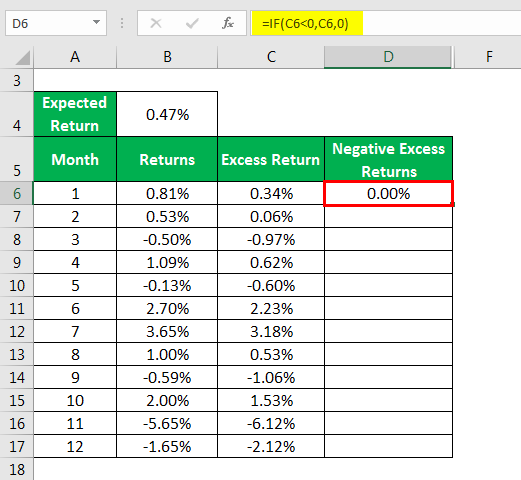
Negative Excess Returns is Calculated as:
Similarly, calculated as below.
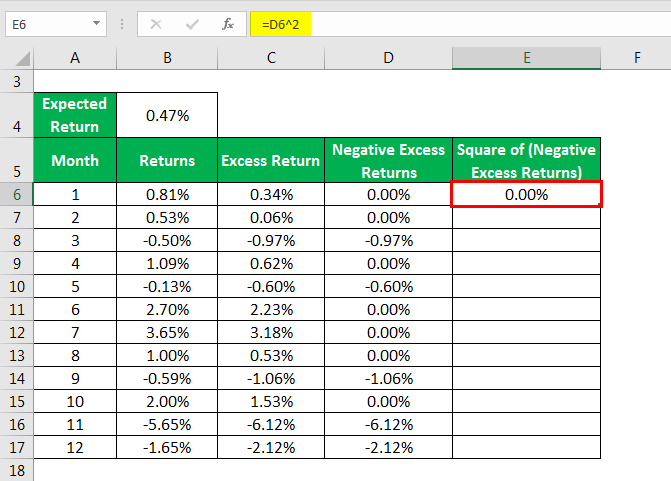
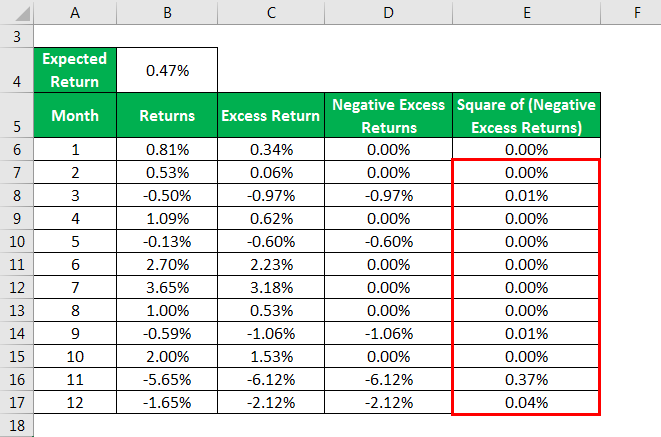
Square of (Negative Excess Returns) is Calculated as:
Similarly, calculated as below.
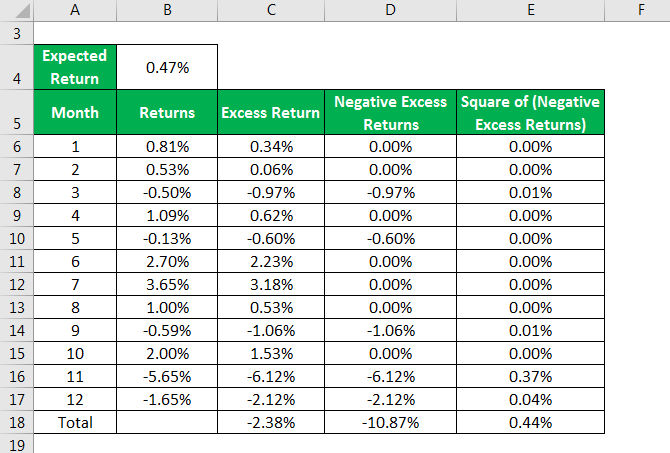
The Sum of the returns has been calculated.
Downside Risk is calculated using the formula given below
Downside Risk = √(∑(Square of Negative Excess Returns) / No. of months)
- Downside Risk = √(∑(0.44%) / ^12)
- Downside Risk = 0.0192296
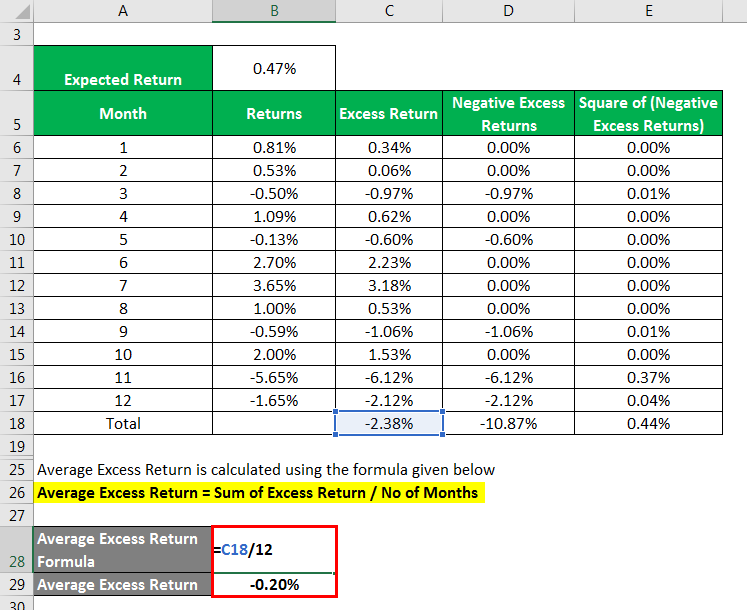
Average Excess Return is calculated using the formula given below
Average Excess Return = Sum of Excess Return / No of Months
- Average Excess Return = -2.38% / 12
- Average Excess Return = -0.20%
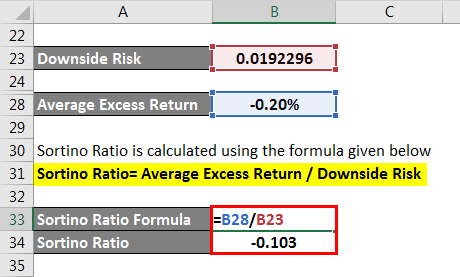
It is calculated using the formula given below
Sortino Ratio = Average Excess Return / Downside Risk
- Sortino Ratio = -0.20% / 0.0192296
- Sortino Ratio = -0.103
Explanation
The formula for Sortino Ratio can be calculated by using the following points:
- From the above definition, it is clear that various investors use the Sortino ratio, and portfolio owners do achieve the expected return. Also, this ration is a lot similar to the sharp ratio. It is a statistical tool used to evaluate an investment risk for a given bad risk level.
- However, under the harmful volatility is eliminated from the portfolio’s total overall volatility, and thus, only meaningful volatility is obtained and more relevant data for analyses. The differentiates the harmful volatility by using the asset’s standard deviation having negative portfolio returns or downward deviation.
- The Sortino ratio provides a better view of the portfolio’s risk-adjusted rate of return and its performance since it gives the benefit of positive volatility.
- Due to the above reason, This is an important way for all the investor, analysts, and portfolio managers to evaluate the return of the investment. This is also because this ratio uses only the downward deviation as its risk factor, while the positive or upward risk or deviation factor is never a factor of worry for analysts.
Features
The features for the same
- One of the important features is that the Sortino ratio is used to select a better portfolio in terms of risk as well as return. The retail investors usually prefer to pick the most favorable scheme for investment in a mutual fund. The selection of such a favorable scheme is very complicated, and hence investors often take help from the Sortino ratio.
- This is often suited more to a retail investor’s analyses than any other investors since they are more concerned with the downward sloping risk, i.e. it gives a Pragmatic view of the risk associated with any scheme of investment.
Usage of Sortino Ratio
The different usage has included the following:
- The Sortino ratio is a ratio extracted from the sharp ratio. However, this ratio extracts the downside risk from the overall risk in place of total risk or standard deviation as taken in the Sharp ratio. Hence it is evidently more useful than the sharp ratio.
- As discussed above, it is more useful to the retail investors to invest and select from various schemes of mutual fund and for the purpose of analyses.
- It evaluates the return on the investment to the investor with a given level of Bad risk. Bad risk is mostly a matter of concern for the investors, and hence this is more useful for financial decision making.
Sortino Ratio v/s Sharpe Ratio
Below the points explain the difference between Sortino Ratio v/s Sharpe Ratio:
- It extracts the bad risk factor or the Negative deviation or downward risk from the total available risk in a given company while the Sharpe ratio takes into consideration the total standard deviation of a given company.
- It is a broader concept, while the Sharpe ratio is a narrower concept from analysts and investors’ viewpoint.
- The Sharpe ratio punishes the given level of the portfolio for the good risk that is for the risk that gives positive returns to the investors, while this is a better ratio since it punishes the bad risk factor or the risk that gives negative returns to the investors. This is the reason why the Sharpe ratio is less popular among the investors, and it is more popular. However, it may sometimes depend on the investor whether they want to focus on good risk or bad risk.
Sortino Ratio Formula Calculator
You can use the following Calculator
| Average Excess Return (%) | |
| Downside Risk | |
| Sortino Ratio | |
| Sortino Ratio= | Average Excess Return /Downside Risk |
| 0 / 0 = 0 |
Conclusion
Thus, like any other Ratio in finance, the Sortino ratio is a widely used statistical tool used by the investor to determine the return from the asset portfolio with the given level of risk; however, in this takes the bad risk factor; hence it is more useful. Further, the complication in the investment decision can be eased by the use of the order to earn a maximum possible return from a given company or a portfolio of the various assets with minimum acceptable risk.
Recommended Articles
This is a guide to Sortino Ratio. Here we discuss how to calculate the Sortino Ratio along with practical examples. We also provide a calculator and a downloadable excel template. You may also look at the following articles to learn more –

